Examples for the mvnram() function
Ivan Jacob Agaloos Pesigan
2020-07-17
Source:vignettes/examples/examples_mvnram.Rmd
examples_mvnram.Rmdlibrary(jeksterslabRdata)
Documentation
See mvnram() for more details.
Examples
Specify mu
Single Random Data Set
Set matrices.
mu <- c(100, 100, 100)
A <- matrix(
  data = c(0, sqrt(0.26), 0, 0, 0, sqrt(0.26), 0, 0, 0),
  ncol = 3
)
S <- diag(c(225, 166.5, 116.5))
F <- I <- diag(3)
Run the function.
X <- mvnram(n = 100, mu = mu, A = A, S = S, F = F, I = I)
Explore the output.
str(X)
#>  num [1:100, 1:3] 116.4 123.2 102.3 94.1 85 ...
#>  - attr(*, "dimnames")=List of 2
#>   ..$ : NULL
#>   ..$ : NULL
pairs(X)
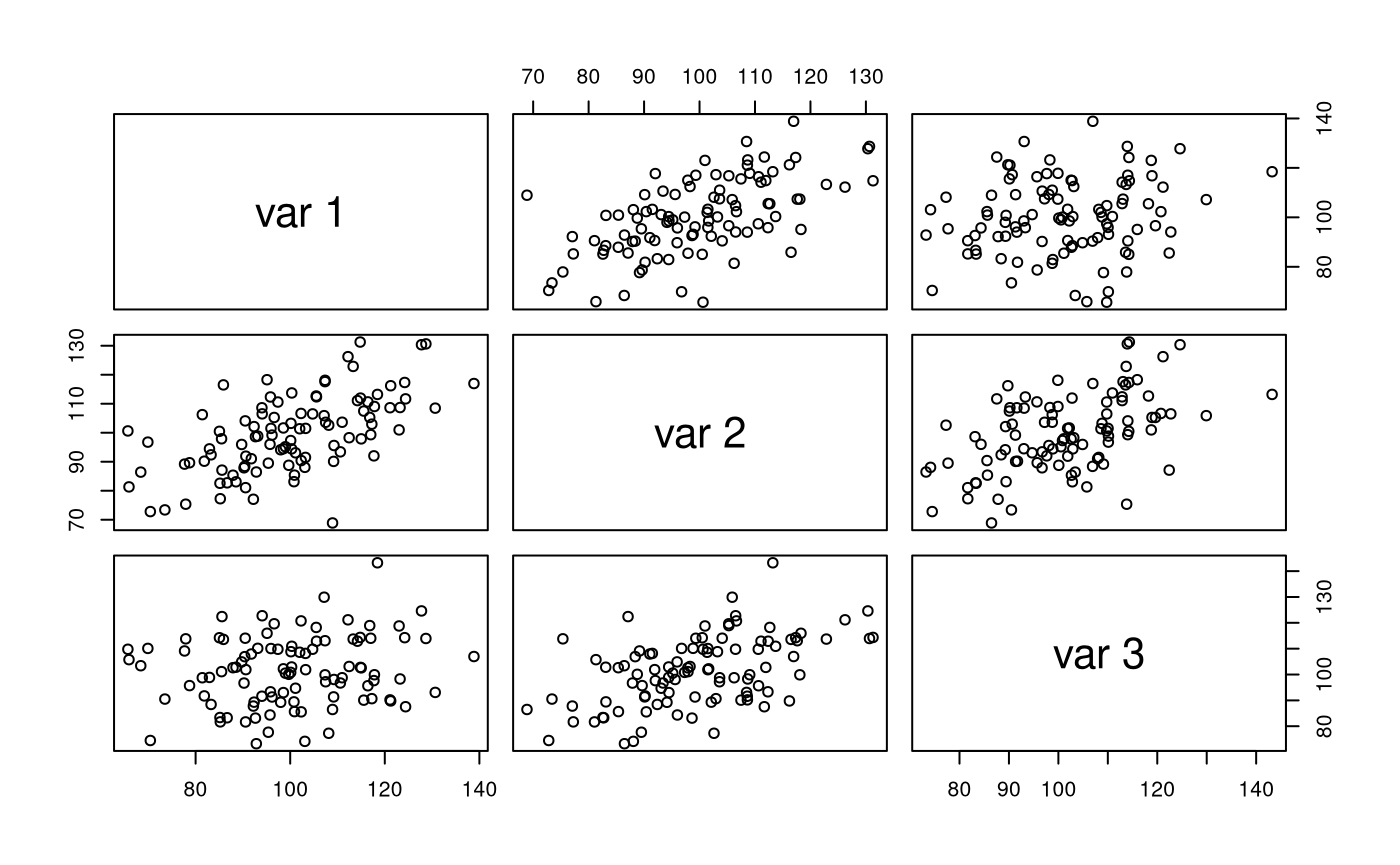
colMeans(X)
#> [1] 100.19438  99.57603 101.34963
cov(X)
#>           [,1]      [,2]      [,3]
#> [1,] 233.75148 120.30450  32.78528
#> [2,] 120.30450 172.80830  88.75994
#> [3,]  32.78528  88.75994 177.16586
cor(X)
#>           [,1]      [,2]      [,3]
#> [1,] 1.0000000 0.5985802 0.1611060
#> [2,] 0.5985802 1.0000000 0.5072764
#> [3,] 0.1611060 0.5072764 1.0000000
Multiple Random Data Sets
Run the function.
Xstar <- mvnram(n = 100, mu = mu, A = A, S = S, F = F, I = I, R = 100)
Explore the output.
str(Xstar, list.len = 6)
#> List of 100
#>  $ : num [1:100, 1:3] 92 97 108.6 102.6 69.6 ...
#>   ..- attr(*, "dimnames")=List of 2
#>   .. ..$ : NULL
#>   .. ..$ : NULL
#>  $ : num [1:100, 1:3] 95.3 75.7 104.7 107.3 105.4 ...
#>   ..- attr(*, "dimnames")=List of 2
#>   .. ..$ : NULL
#>   .. ..$ : NULL
#>  $ : num [1:100, 1:3] 97.7 84.1 102.9 103.4 92.7 ...
#>   ..- attr(*, "dimnames")=List of 2
#>   .. ..$ : NULL
#>   .. ..$ : NULL
#>  $ : num [1:100, 1:3] 80.3 87.9 93.5 99.2 136.1 ...
#>   ..- attr(*, "dimnames")=List of 2
#>   .. ..$ : NULL
#>   .. ..$ : NULL
#>  $ : num [1:100, 1:3] 124.2 95.3 92.1 85.3 123.5 ...
#>   ..- attr(*, "dimnames")=List of 2
#>   .. ..$ : NULL
#>   .. ..$ : NULL
#>  $ : num [1:100, 1:3] 122.9 90.6 102.5 85.9 99.2 ...
#>   ..- attr(*, "dimnames")=List of 2
#>   .. ..$ : NULL
#>   .. ..$ : NULL
#>   [list output truncated]
Specify M
Single Random Data Set
Set matrices.
M <- c(100, 50, 50)
A <- matrix(
  data = c(0, sqrt(0.26), 0, 0, 0, sqrt(0.26), 0, 0, 0),
  ncol = 3
)
S <- diag(c(225, 166.5, 116.5))
F <- I <- diag(3)
Run the function.
X <- mvnram(n = 100, M = M, A = A, S = S, F = F, I = I)
#> mu = NULL. mu is computed using M.
Explore the output.
str(X)
#>  num [1:100, 1:3] 135 102 123 120 101 ...
#>  - attr(*, "dimnames")=List of 2
#>   ..$ : NULL
#>   ..$ : NULL
pairs(X)
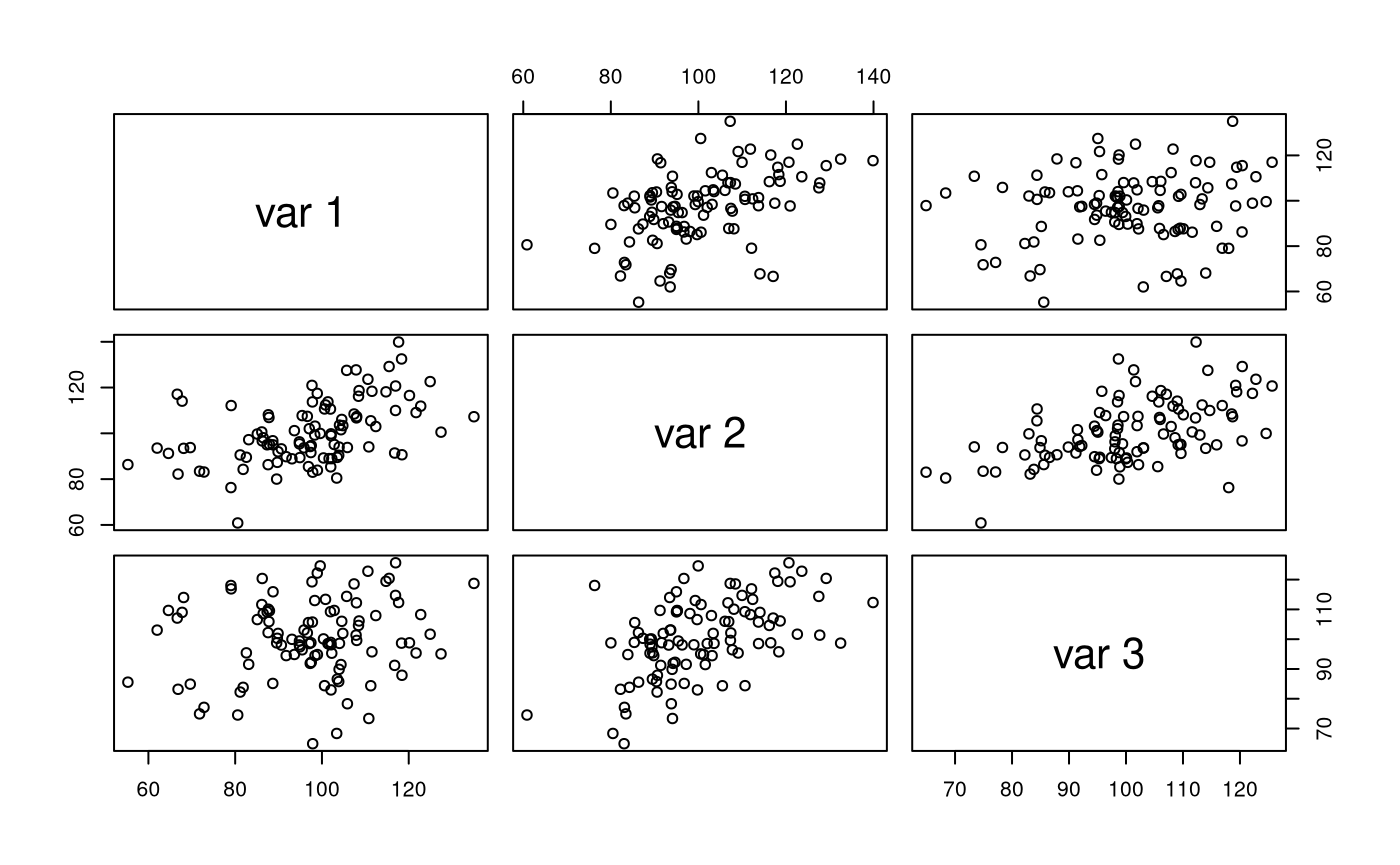
colMeans(X)
#> [1]  97.31431 100.53197 100.31598
cov(X)
#>           [,1]      [,2]      [,3]
#> [1,] 235.85233 100.32570  28.67039
#> [2,] 100.32570 187.86525  94.03889
#> [3,]  28.67039  94.03889 168.80888
cor(X)
#>           [,1]      [,2]      [,3]
#> [1,] 1.0000000 0.4766163 0.1436865
#> [2,] 0.4766163 1.0000000 0.5280641
#> [3,] 0.1436865 0.5280641 1.0000000
Multiple Random Data Sets
Run the function.
Xstar <- mvnram(n = 100, M = M, A = A, S = S, F = F, I = I, R = 100)
#> mu = NULL. mu is computed using M.
Explore the output.
str(Xstar, list.len = 6)
#> List of 100
#>  $ : num [1:100, 1:3] 96.5 97.6 100 82 95.4 ...
#>   ..- attr(*, "dimnames")=List of 2
#>   .. ..$ : NULL
#>   .. ..$ : NULL
#>  $ : num [1:100, 1:3] 106.2 86.4 107.6 122.3 61.9 ...
#>   ..- attr(*, "dimnames")=List of 2
#>   .. ..$ : NULL
#>   .. ..$ : NULL
#>  $ : num [1:100, 1:3] 101.5 99 96.3 90.1 96.4 ...
#>   ..- attr(*, "dimnames")=List of 2
#>   .. ..$ : NULL
#>   .. ..$ : NULL
#>  $ : num [1:100, 1:3] 102.3 106.3 99.4 100.3 87.9 ...
#>   ..- attr(*, "dimnames")=List of 2
#>   .. ..$ : NULL
#>   .. ..$ : NULL
#>  $ : num [1:100, 1:3] 86.9 90.3 80.5 93.5 107.5 ...
#>   ..- attr(*, "dimnames")=List of 2
#>   .. ..$ : NULL
#>   .. ..$ : NULL
#>  $ : num [1:100, 1:3] 124.3 123.2 104.2 89.8 75.5 ...
#>   ..- attr(*, "dimnames")=List of 2
#>   .. ..$ : NULL
#>   .. ..$ : NULL
#>   [list output truncated]
Specify mu = NULL and M = NULL
Single Random Data Set
Set matrices.
A <- matrix(
  data = c(0, sqrt(0.26), 0, 0, 0, sqrt(0.26), 0, 0, 0),
  ncol = 3
)
S <- diag(c(225, 166.5, 116.5))
F <- I <- diag(3)
Run the function.
X <- mvnram(n = 100, A = A, S = S, F = F, I = I)
#> mu = NULL and M = NULL. mu is set to a vector of zeroes of length 3.
Explore the output.
str(X)
#>  num [1:100, 1:3] 13.54 27.83 -39.44 9.09 15.09 ...
#>  - attr(*, "dimnames")=List of 2
#>   ..$ : NULL
#>   ..$ : NULL
pairs(X)
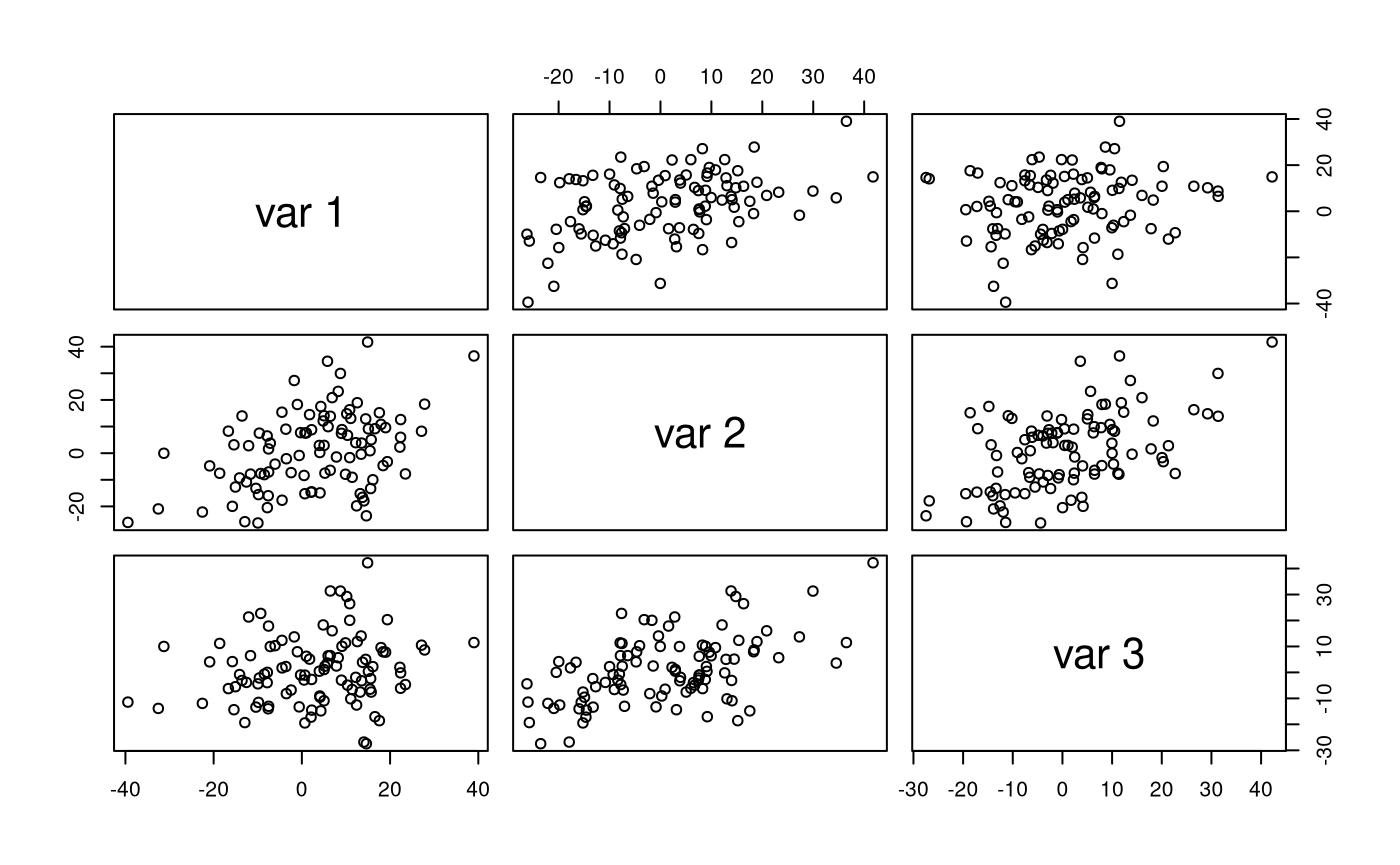
colMeans(X)
#> [1] 2.8054108 0.9003620 0.9547591
cov(X)
#>           [,1]      [,2]      [,3]
#> [1,] 191.48335  82.07489  28.42473
#> [2,]  82.07489 209.60061  97.46495
#> [3,]  28.42473  97.46495 165.89983
cor(X)
#>           [,1]      [,2]      [,3]
#> [1,] 1.0000000 0.4096836 0.1594806
#> [2,] 0.4096836 1.0000000 0.5226720
#> [3,] 0.1594806 0.5226720 1.0000000
Multiple Random Data Sets
Run the function.
Xstar <- mvnram(n = 100, A = A, S = S, F = F, I = I, R = 100)
#> mu = NULL and M = NULL. mu is set to a vector of zeroes of length 3.
Explore the output.
str(Xstar, list.len = 6)
#> List of 100
#>  $ : num [1:100, 1:3] -21.7 -5.07 14.77 -8.65 17.68 ...
#>   ..- attr(*, "dimnames")=List of 2
#>   .. ..$ : NULL
#>   .. ..$ : NULL
#>  $ : num [1:100, 1:3] 21.3 -4.06 16.99 1.25 1.38 ...
#>   ..- attr(*, "dimnames")=List of 2
#>   .. ..$ : NULL
#>   .. ..$ : NULL
#>  $ : num [1:100, 1:3] -12.47 7.89 25.38 -12.22 17.7 ...
#>   ..- attr(*, "dimnames")=List of 2
#>   .. ..$ : NULL
#>   .. ..$ : NULL
#>  $ : num [1:100, 1:3] -12.052 16.808 -10.155 -0.909 7.512 ...
#>   ..- attr(*, "dimnames")=List of 2
#>   .. ..$ : NULL
#>   .. ..$ : NULL
#>  $ : num [1:100, 1:3] -6.03 -1.75 -23.05 -12.42 -20.21 ...
#>   ..- attr(*, "dimnames")=List of 2
#>   .. ..$ : NULL
#>   .. ..$ : NULL
#>  $ : num [1:100, 1:3] -17.382 -3.679 6.524 -12.873 0.449 ...
#>   ..- attr(*, "dimnames")=List of 2
#>   .. ..$ : NULL
#>   .. ..$ : NULL
#>   [list output truncated]