Examples for the fit() function
Ivan Jacob Agaloos Pesigan
2020-07-17
Source:vignettes/examples/examples_fit.Rmd
examples_fit.Rmdlibrary(jeksterslabRdata)
Documentation
See fit() for more details.
Examples
univ()
Normal Distribution
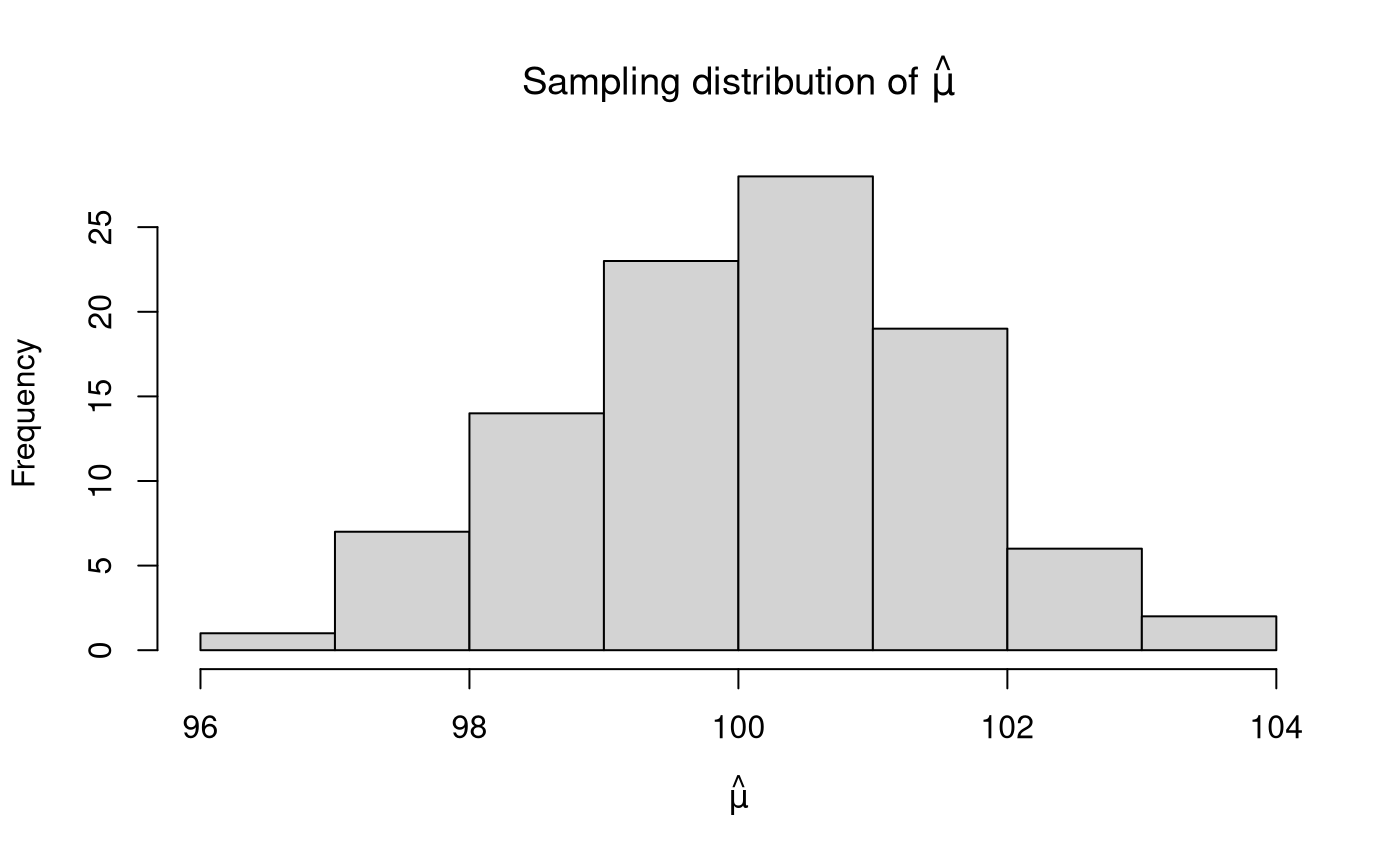
Fit the mean() Function Using fit()
Run the function.
thetahatstar <- fit(Xstar = xstar, fitFUN = mean, rbind = TRUE)
Explore the output.
str(thetahatstar)
#>  num [1:100, 1] 99.7 101 99.6 98.1 100.9 ...
hist(thetahatstar,
  main = expression("Sampling distribution of" ~ hat(mu)),
  xlab = expression(hat(mu))
)
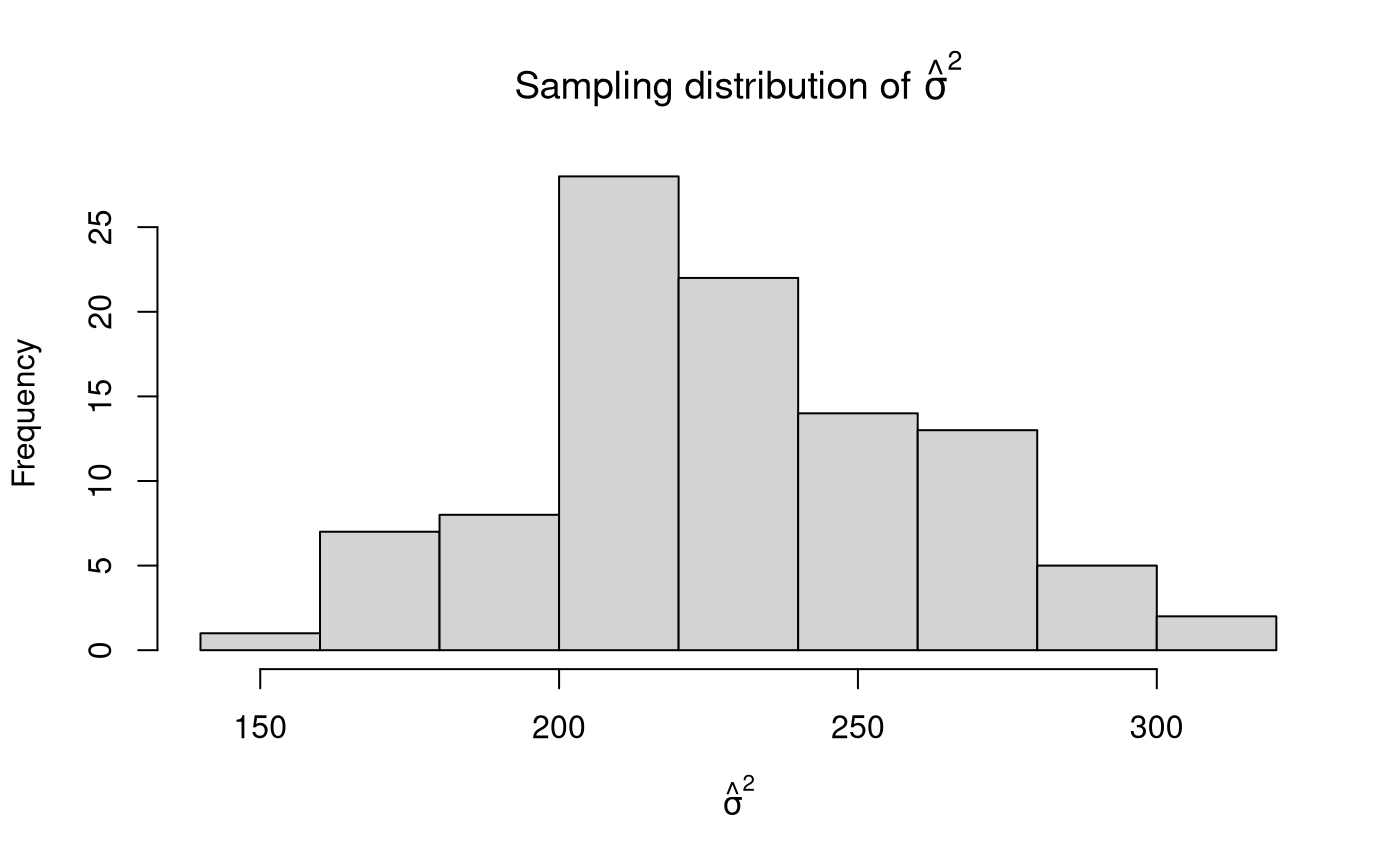
Fit the var() Function Using fit()
Run the function.
thetahatstar <- fit(Xstar = xstar, fitFUN = var, rbind = TRUE)
Explore the output.
str(thetahatstar)
#>  num [1:100, 1] 251 234 249 283 303 ...
hist(thetahatstar,
  main = expression("Sampling distribution of" ~ hat(sigma)^2),
  xlab = expression(hat(sigma)^2)
)
Bernoulli Distribution
Generate Data
xstar <- univ(n = 100, rFUN = rbinom, size = 1, prob = 0.50, R = 100)
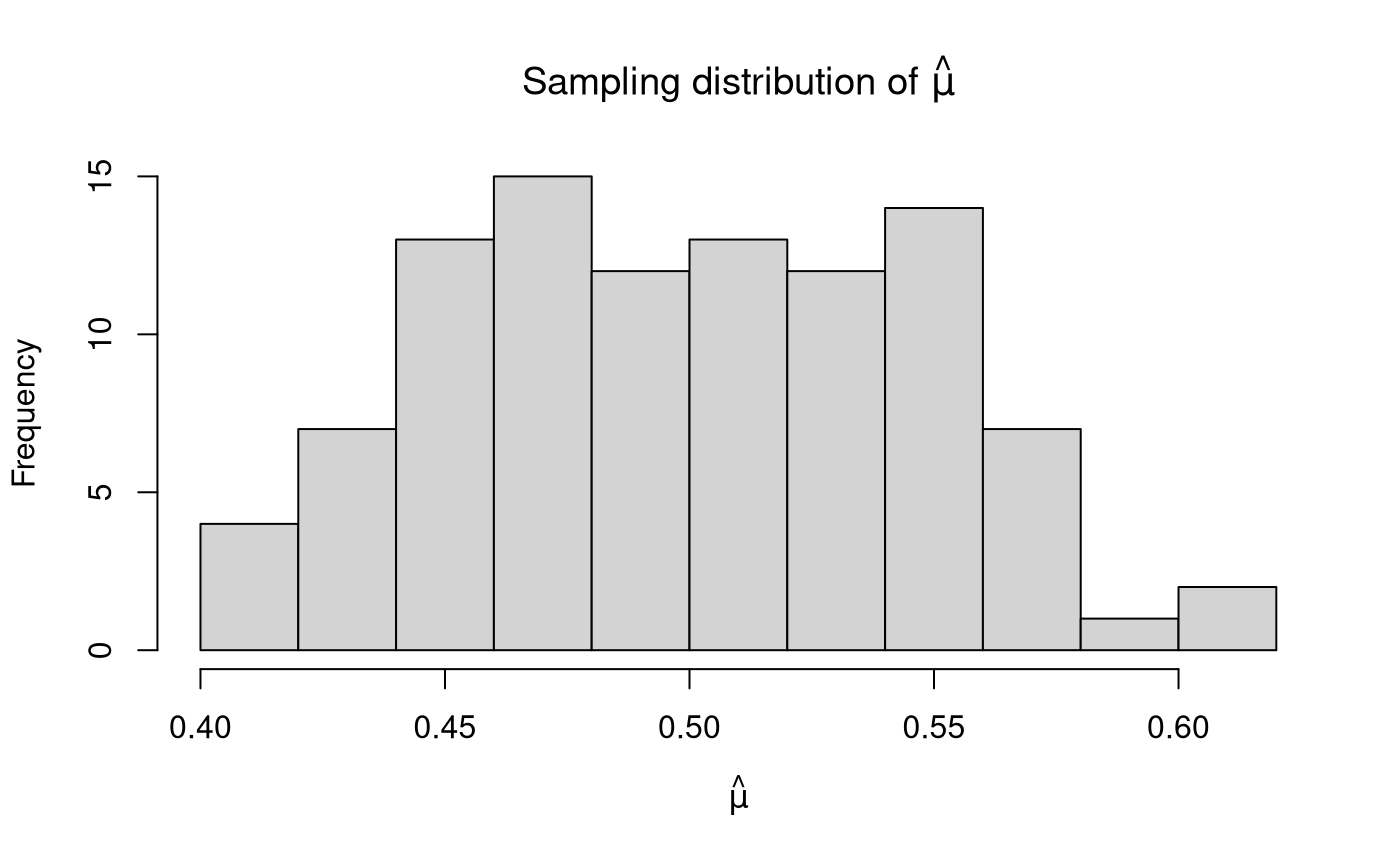
Fit the mean() Function Using fit()
Run the function.
thetahatstar <- fit(Xstar = xstar, fitFUN = mean, rbind = TRUE)
Explore the output.
str(thetahatstar)
#>  num [1:100, 1] 0.48 0.41 0.45 0.55 0.61 0.54 0.5 0.48 0.52 0.47 ...
hist(thetahatstar,
  main = expression("Sampling distribution of" ~ hat(mu)),
  xlab = expression(hat(mu))
)
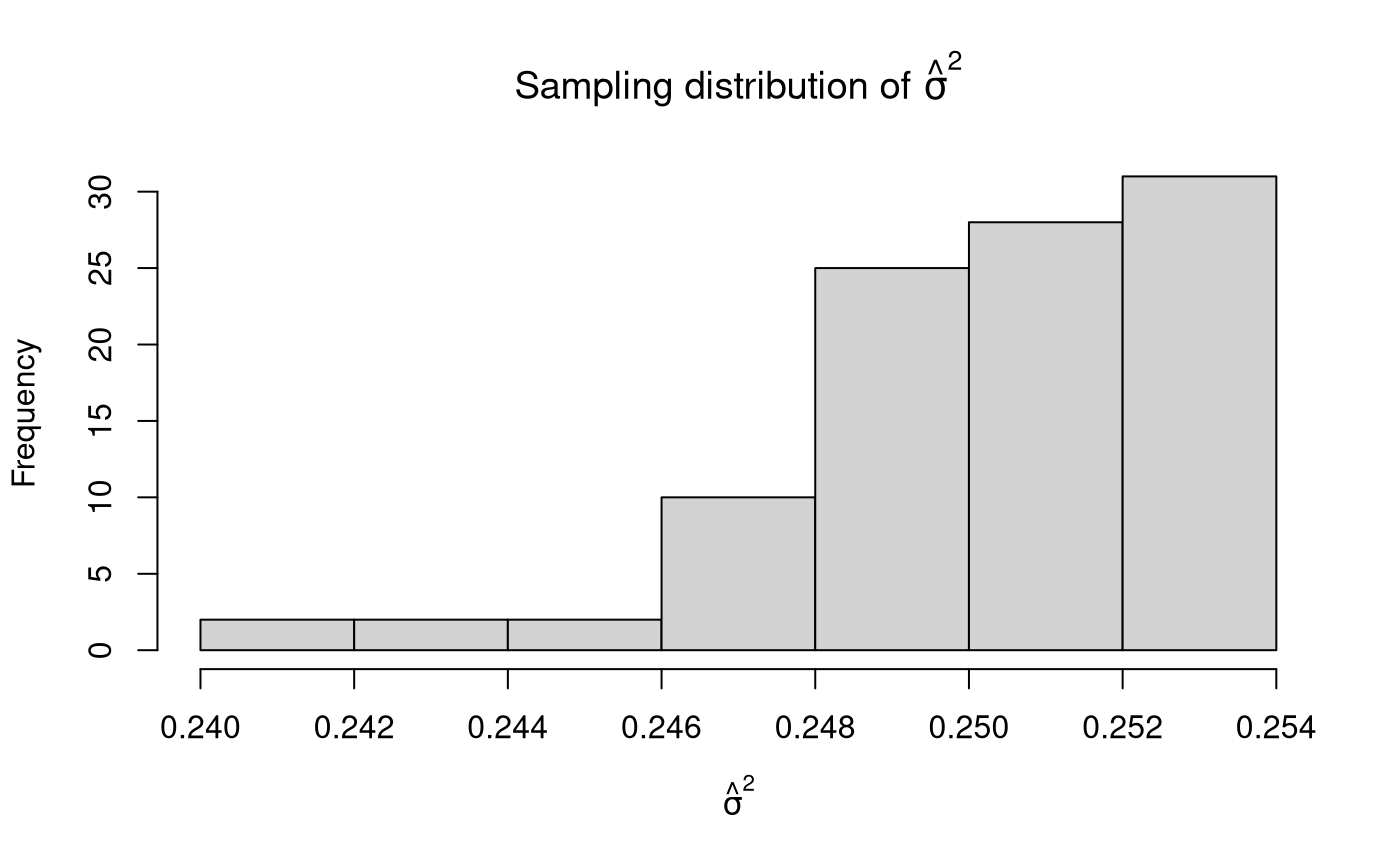
Fit the var() Function Using fit()
Run the function.
thetahatstar <- fit(Xstar = xstar, fitFUN = var, rbind = TRUE)
Explore the output.
str(thetahatstar)
#>  num [1:100, 1] 0.252 0.244 0.25 0.25 0.24 ...
hist(thetahatstar,
  main = expression("Sampling distribution of" ~ hat(sigma)^2),
  xlab = expression(hat(sigma)^2)
)
Binomial Distribution
Generate Data
xstar <- univ(n = 100, rFUN = rbinom, size = 40, prob = 0.50, R = 100)
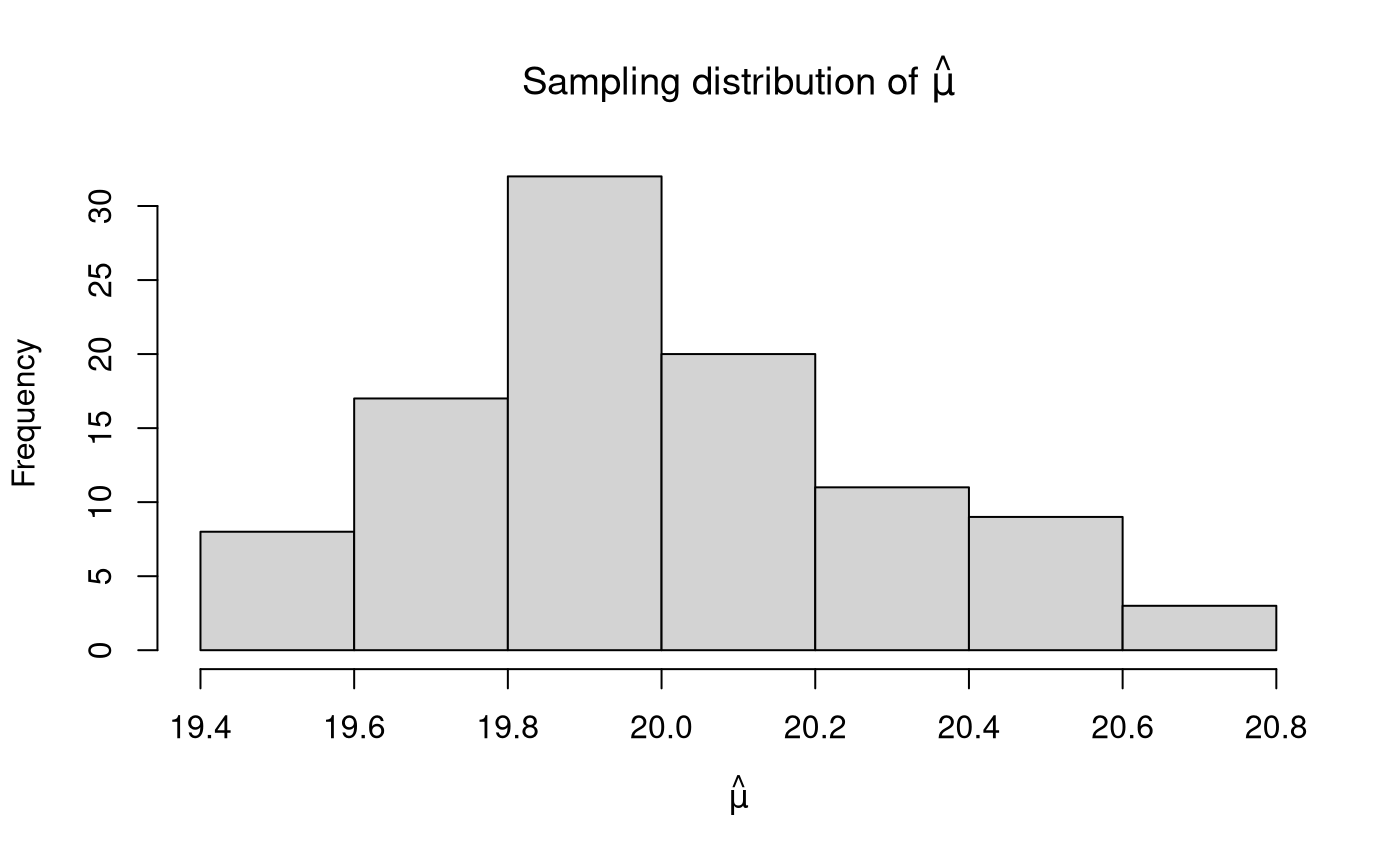
Fit the mean() Function Using fit()
Run the function.
thetahatstar <- fit(Xstar = xstar, fitFUN = mean, rbind = TRUE)
Explore the output.
str(thetahatstar)
#>  num [1:100, 1] 19.9 19.9 20.2 19.9 20 ...
hist(thetahatstar,
  main = expression("Sampling distribution of" ~ hat(mu)),
  xlab = expression(hat(mu))
)
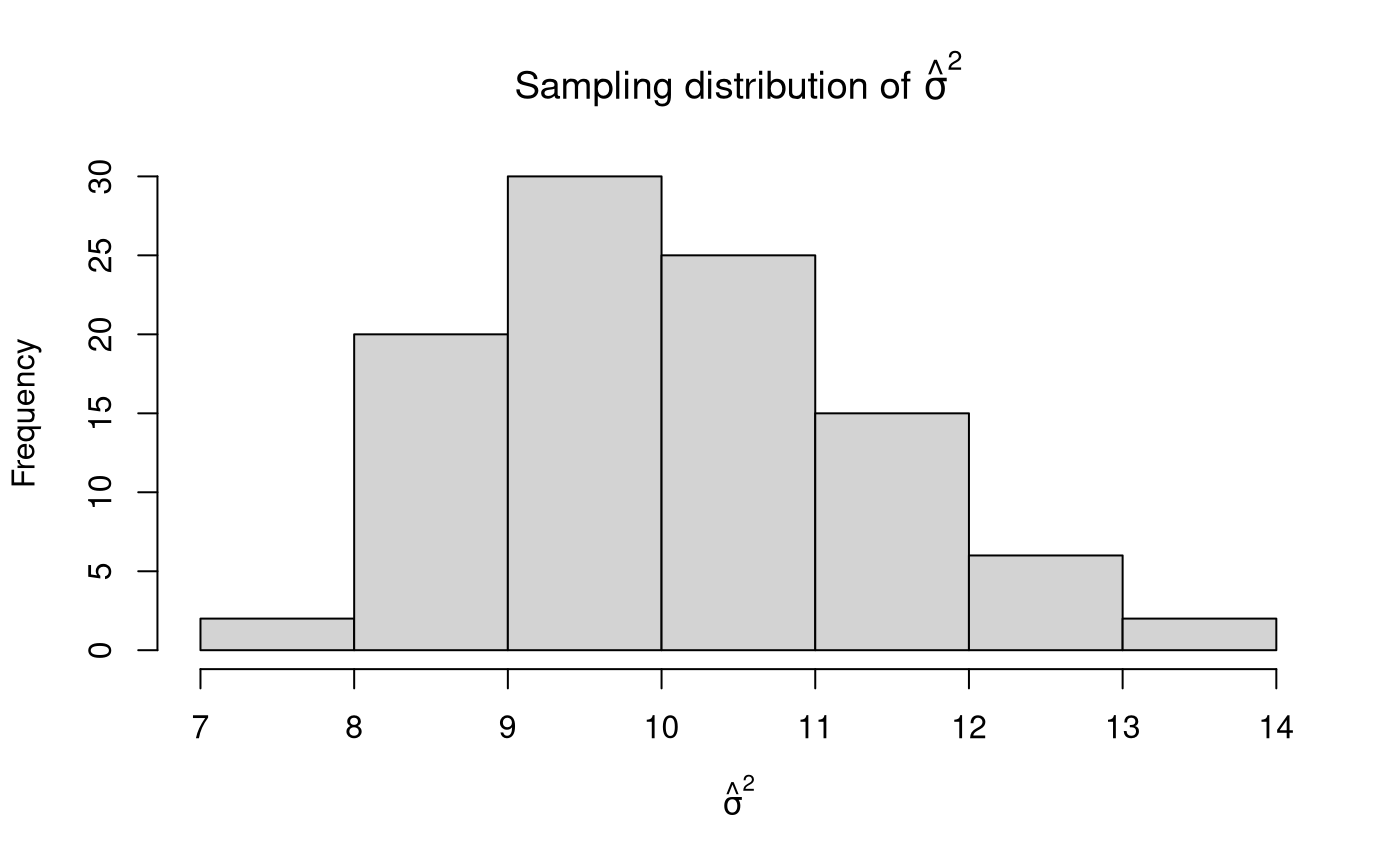
Fit the var() Function Using fit()
Run the function.
thetahatstar <- fit(Xstar = xstar, fitFUN = var, rbind = TRUE)
Explore the output.
str(thetahatstar)
#>  num [1:100, 1] 12.68 11.58 8.61 10.23 12 ...
hist(thetahatstar,
  main = expression("Sampling distribution of" ~ hat(sigma)^2),
  xlab = expression(hat(sigma)^2)
)
mvn()
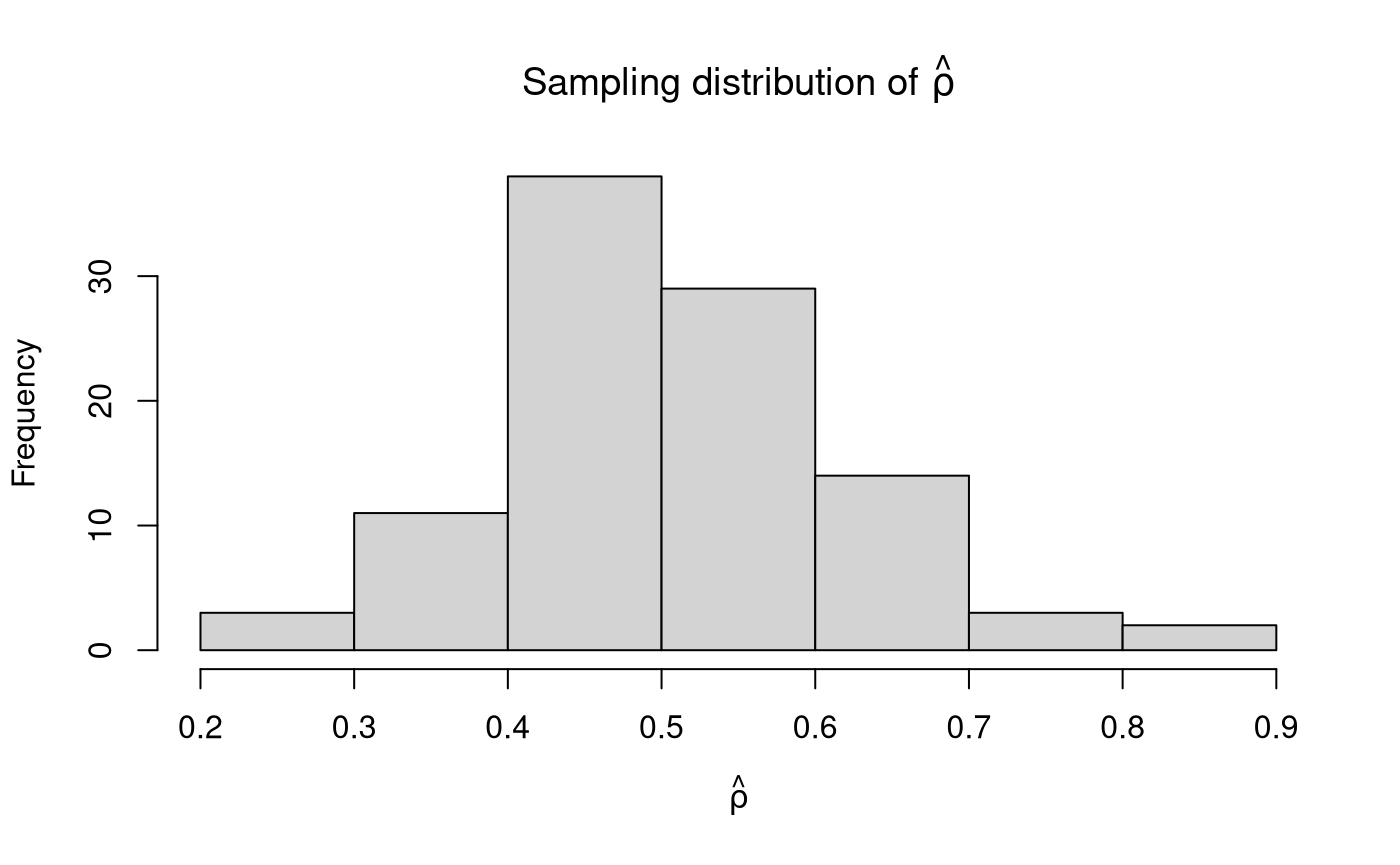
Fit a custom cov() Function Using fit()
Run the function.
foo <- function(X) {
  as.vector(cov(X))
}
thetahatstar <- fit(Xstar = Xstar, fitFUN = foo, rbind = TRUE)
Explore the output.
thetahatstar <- thetahatstar[, 2]
str(thetahatstar)
#>  num [1:100] 0.36 0.37 0.472 0.488 0.592 ...
hist(thetahatstar,
  main = expression("Sampling distribution of" ~ hat(rho)),
  xlab = expression(hat(rho))
)