Alpha Level
Two-Tailed
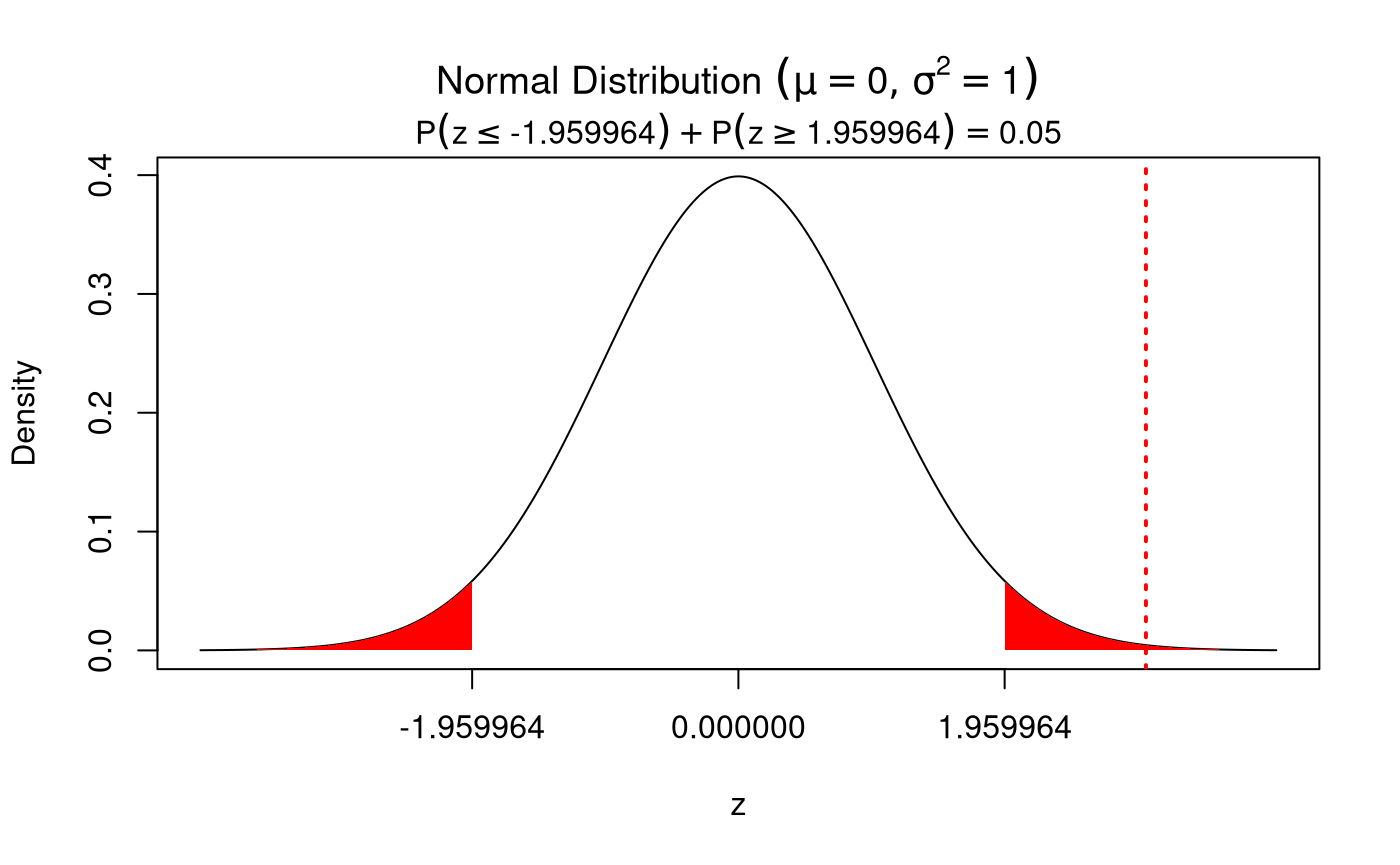
nhstplot(
  alpha = 0.05,
  dist = "z",
  statistic = 3
)
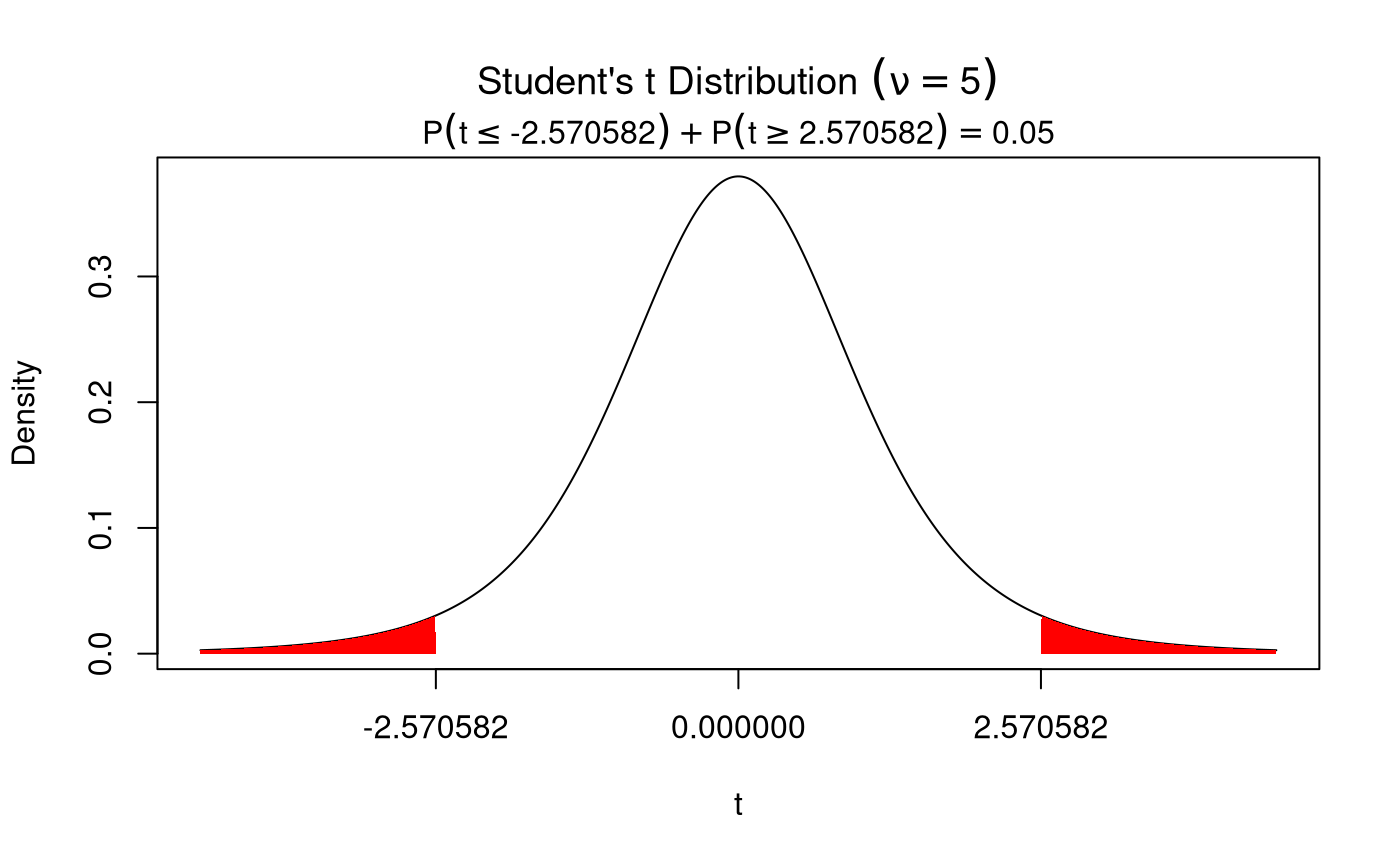
nhstplot(
  alpha = 0.05,
  dist = "t",
  df = 5
)
One-Tailed
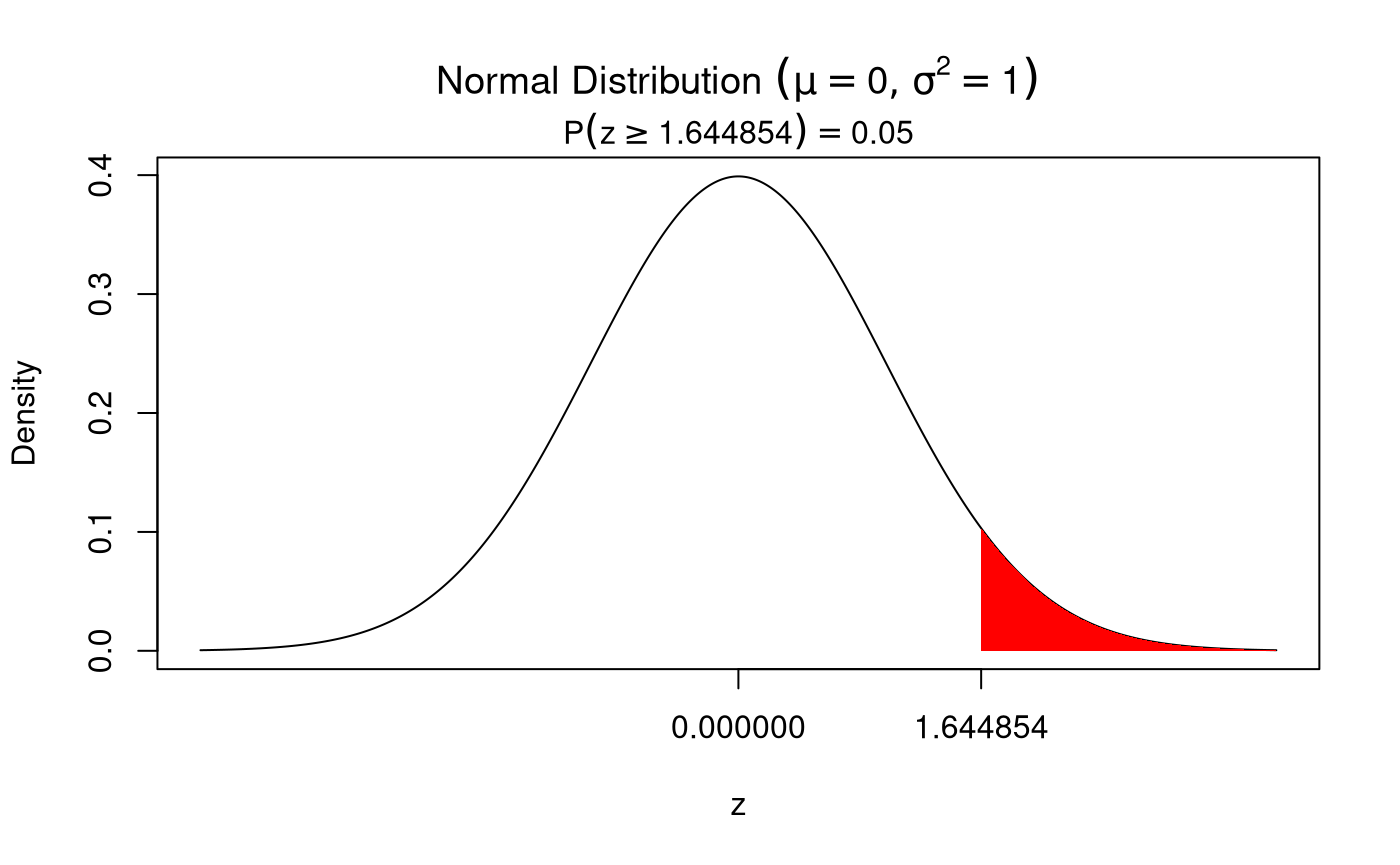
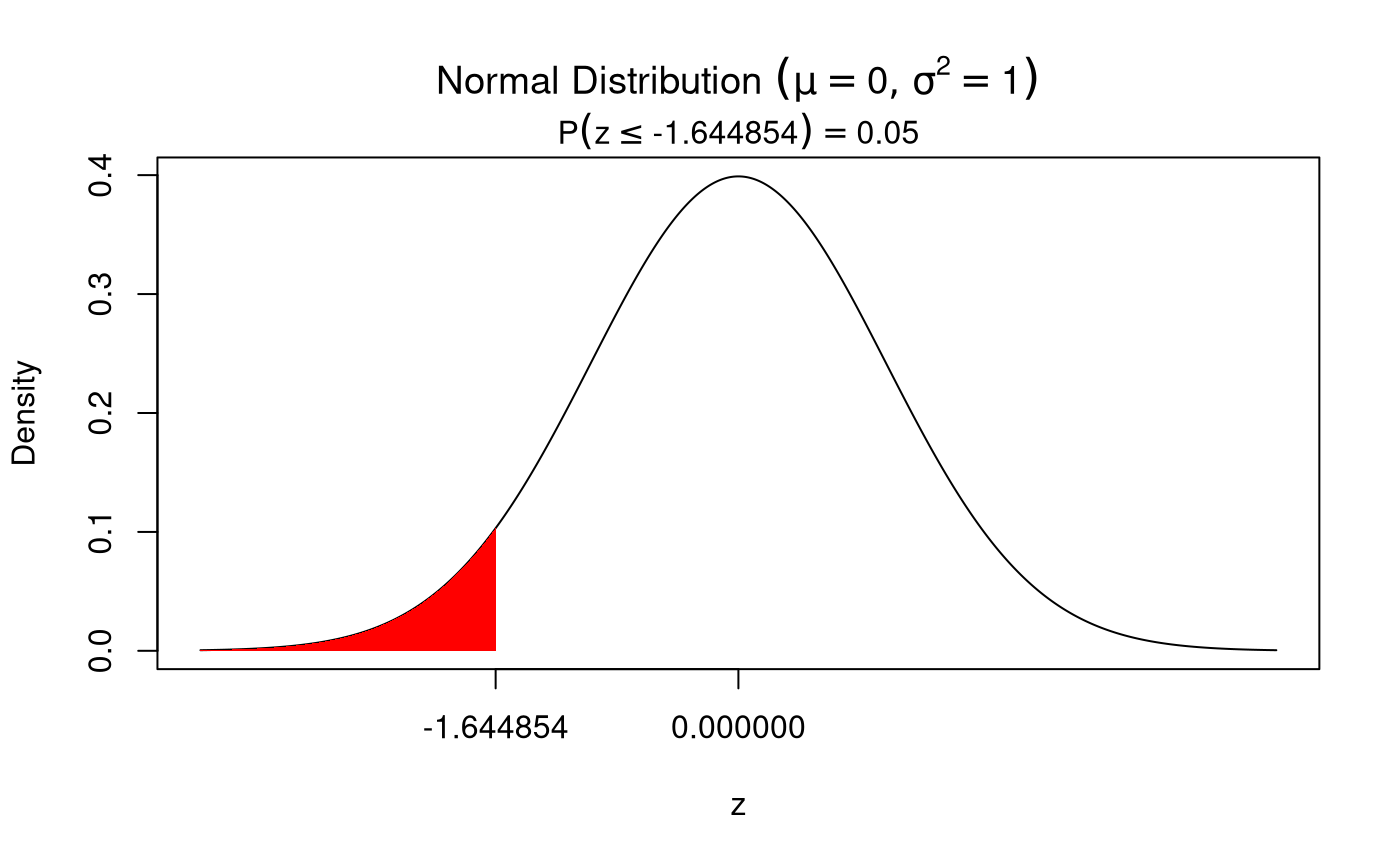
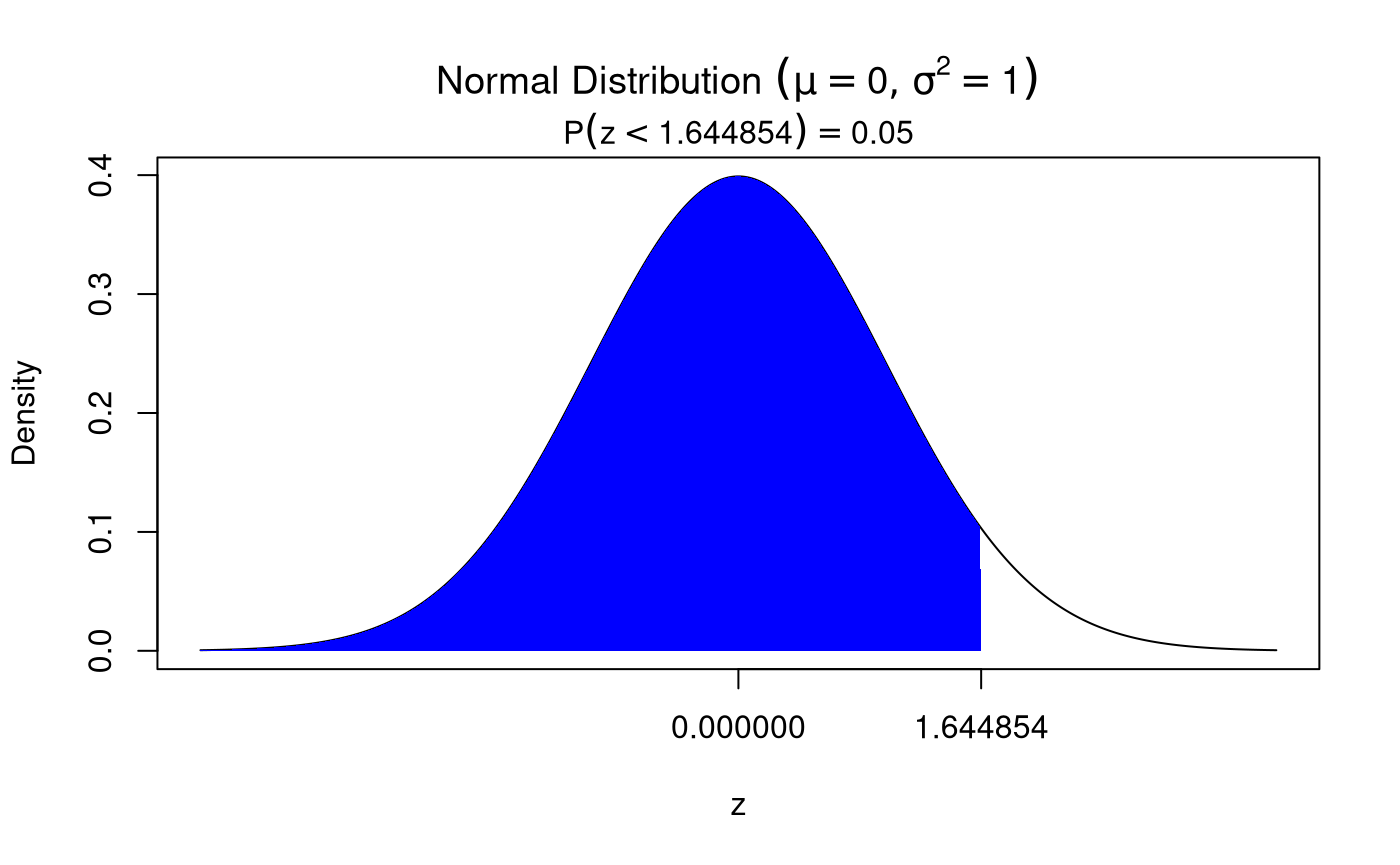
nhstplot(
  alpha = 0.05,
  two.tailed = FALSE,
  right.tail = TRUE
)
nhstplot(
  alpha = 0.05,
  two.tailed = FALSE,
  right.tail = FALSE
)
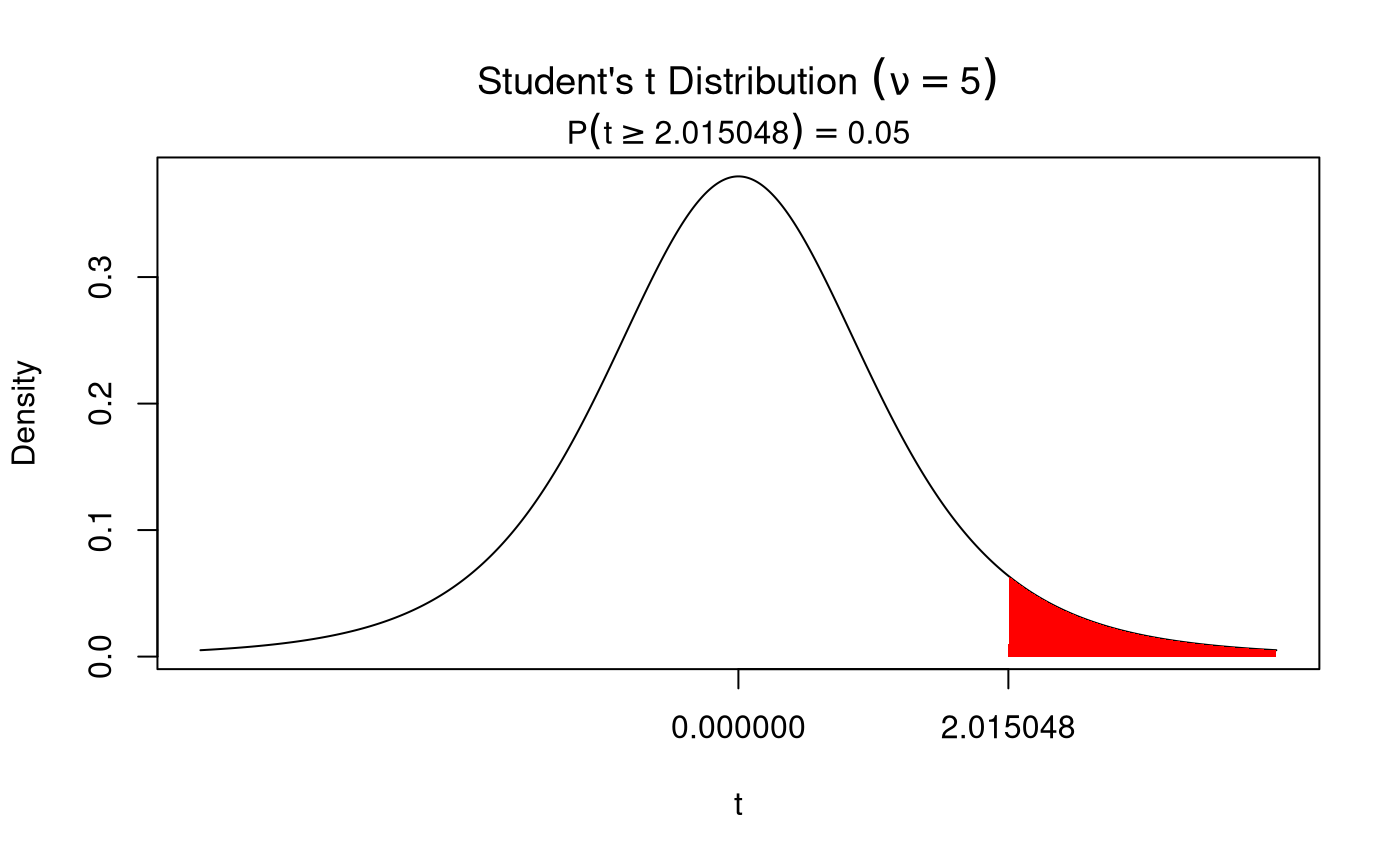
nhstplot(
  alpha = 0.05,
  dist = "t",
  two.tailed = FALSE,
  right.tail = TRUE,
  df = 5
)
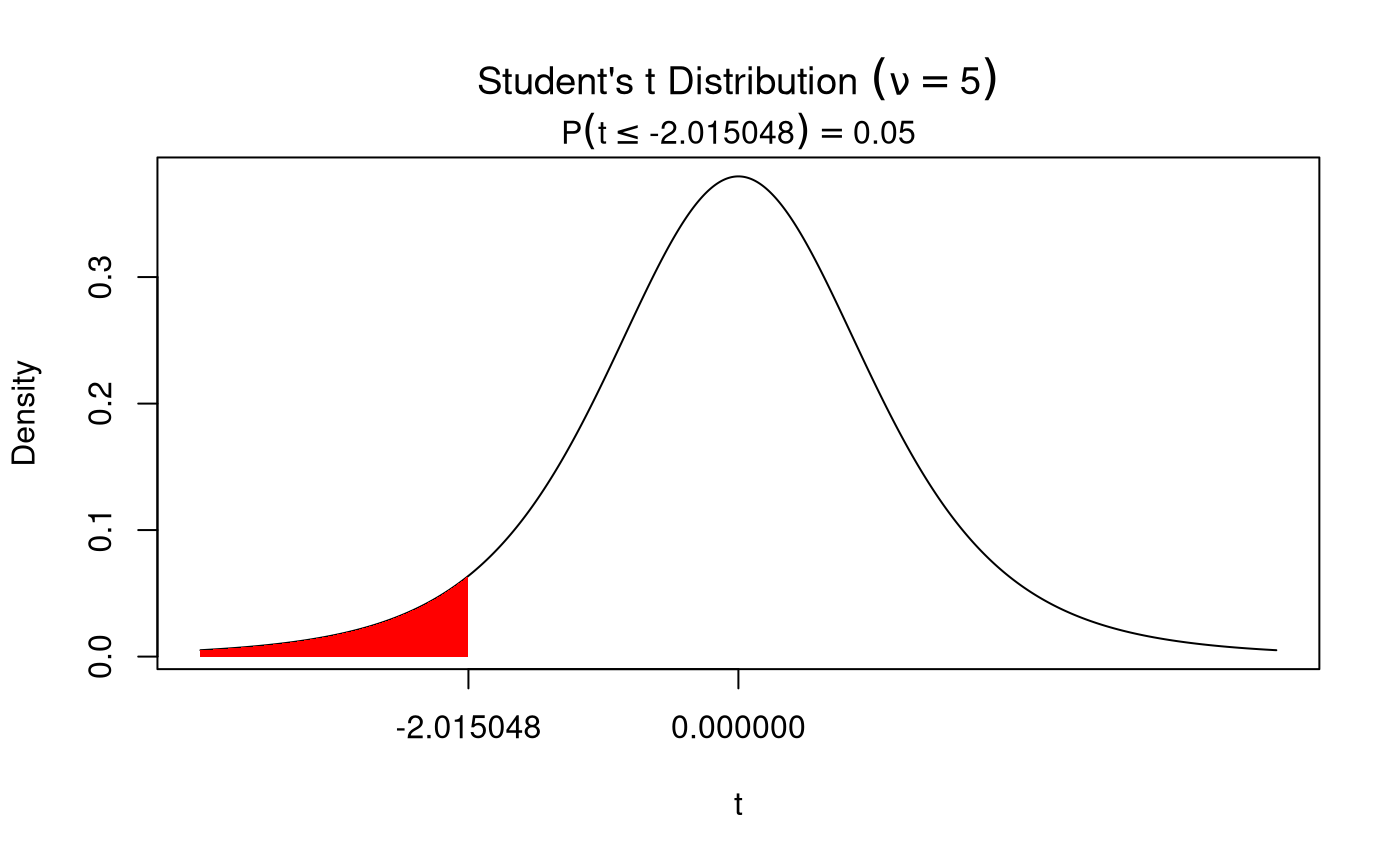
nhstplot(
  alpha = 0.05,
  dist = "t",
  two.tailed = FALSE,
  right.tail = FALSE,
  df = 5
)
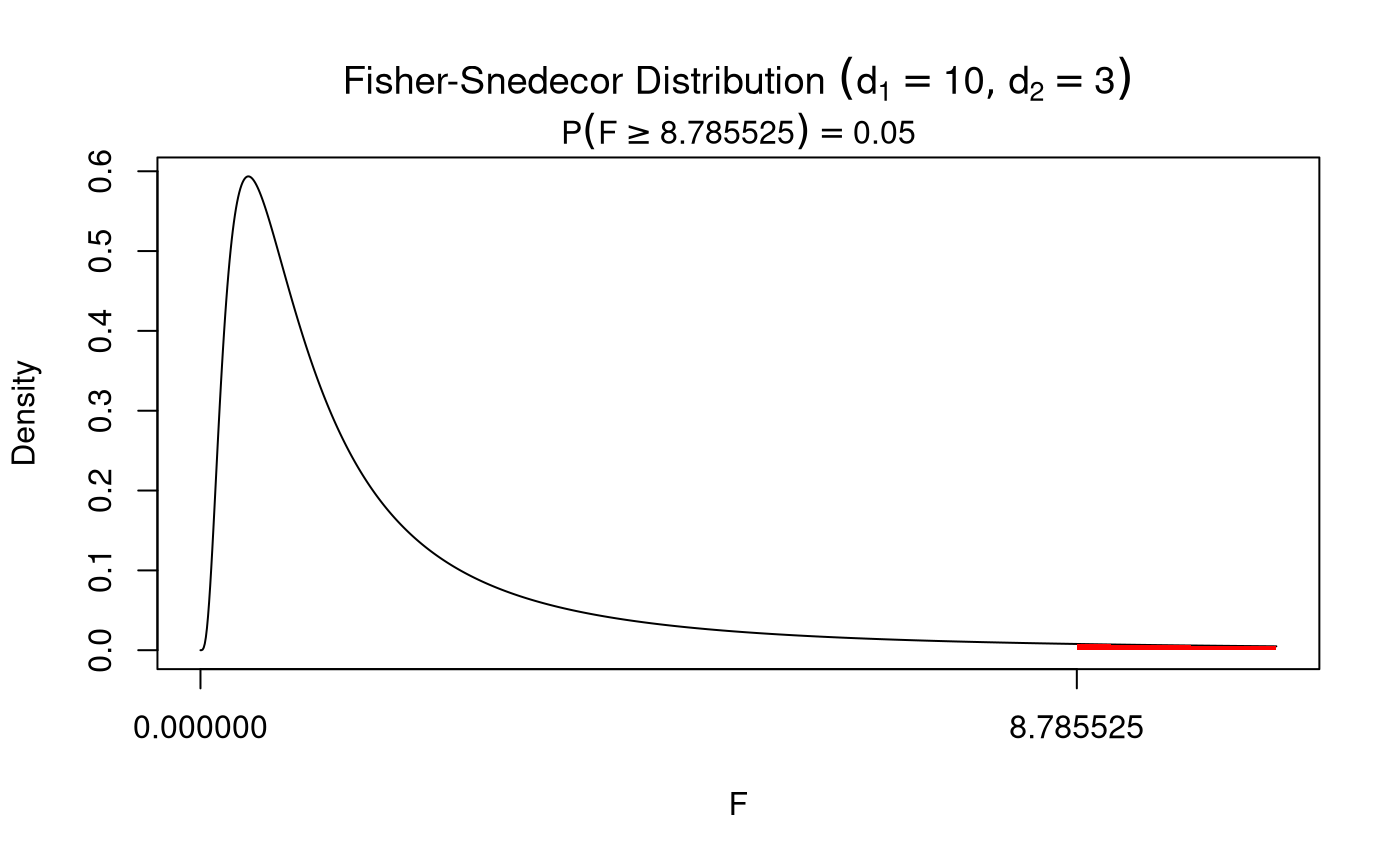
nhstplot(
  alpha = 0.05,
  dist = "F",
  df1 = 10,
  df2 = 3
)
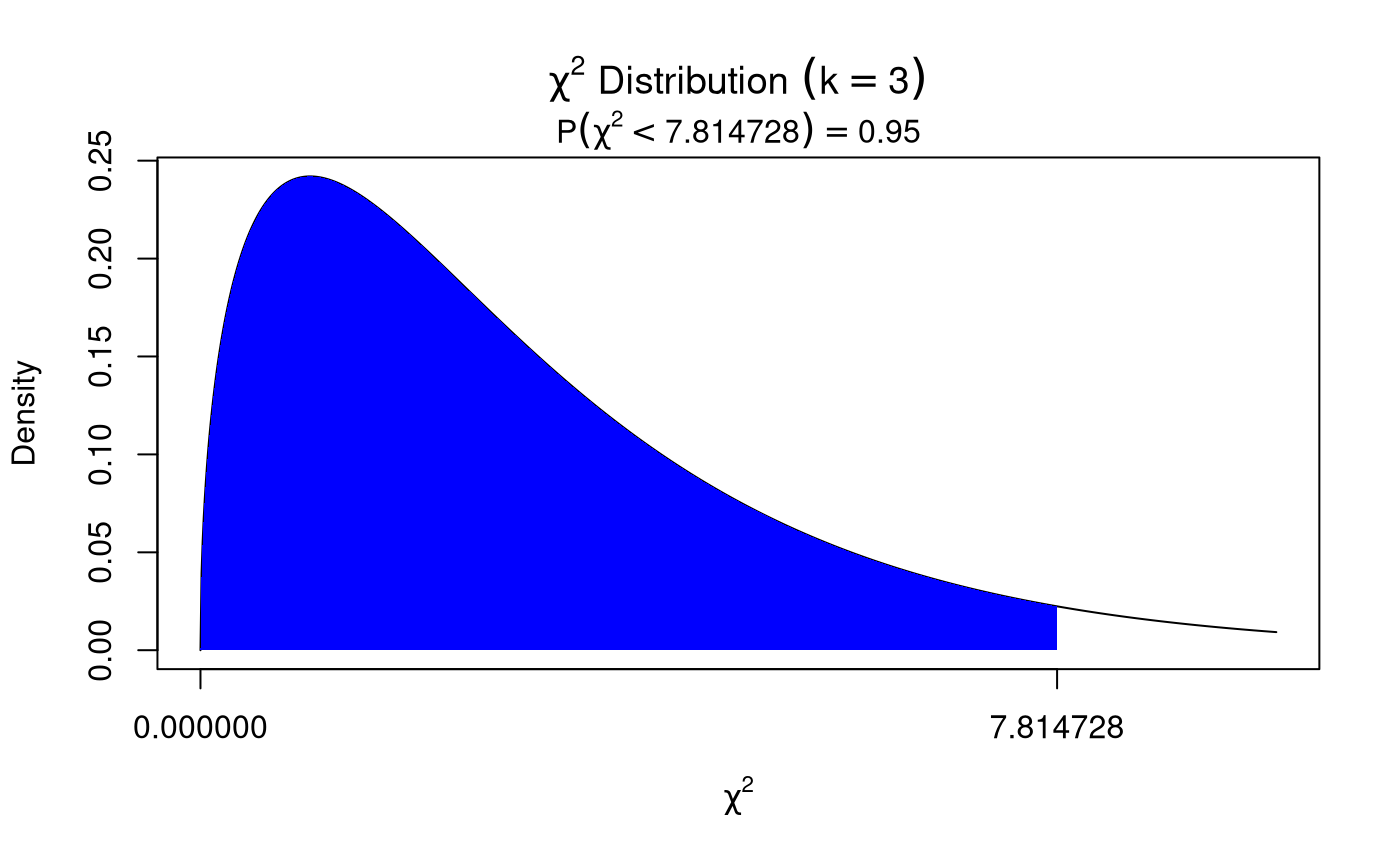
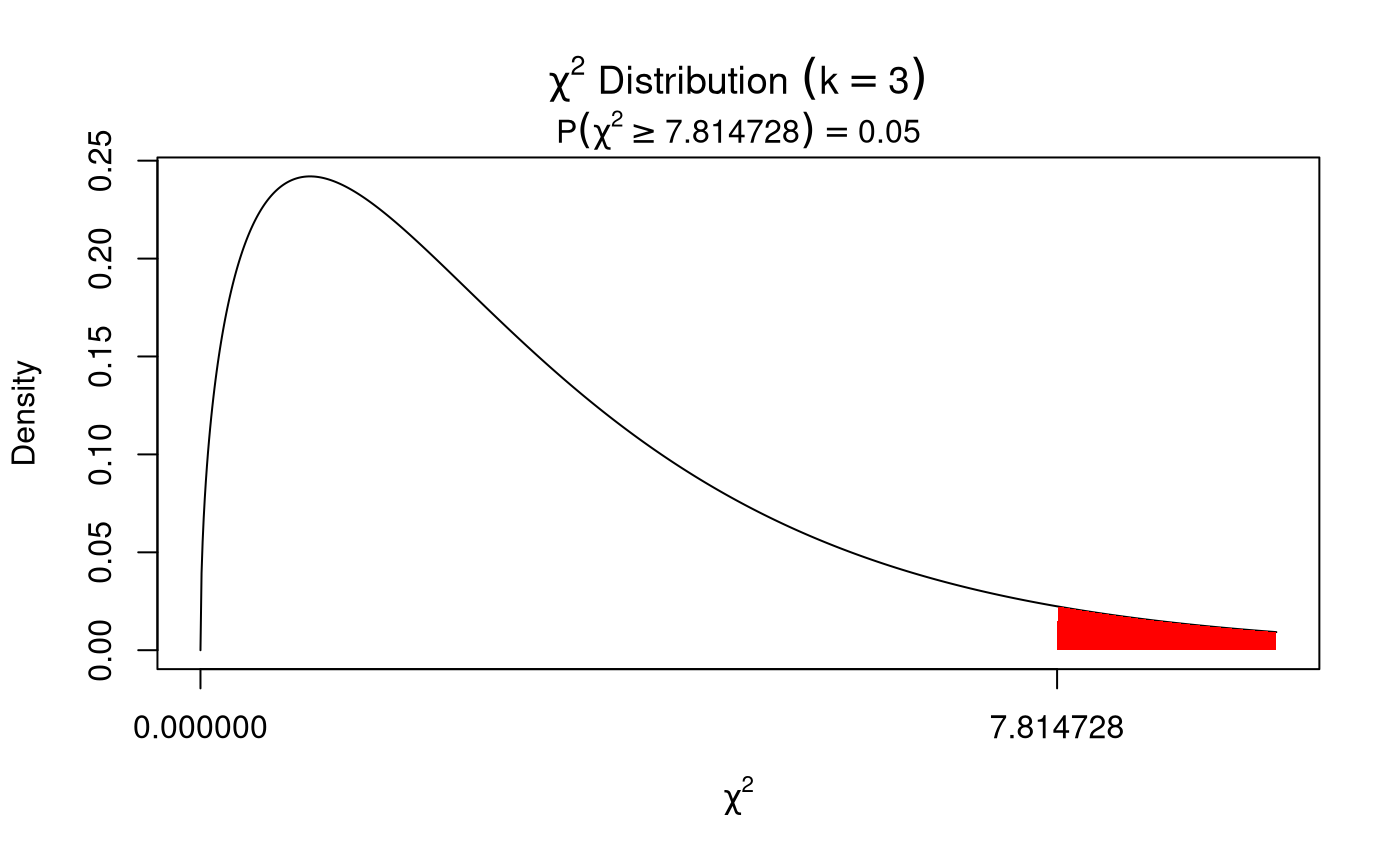
nhstplot(
  alpha = 0.05,
  dist = "chisq",
  df = 3
)
Confidence Interval
Two-Tailed
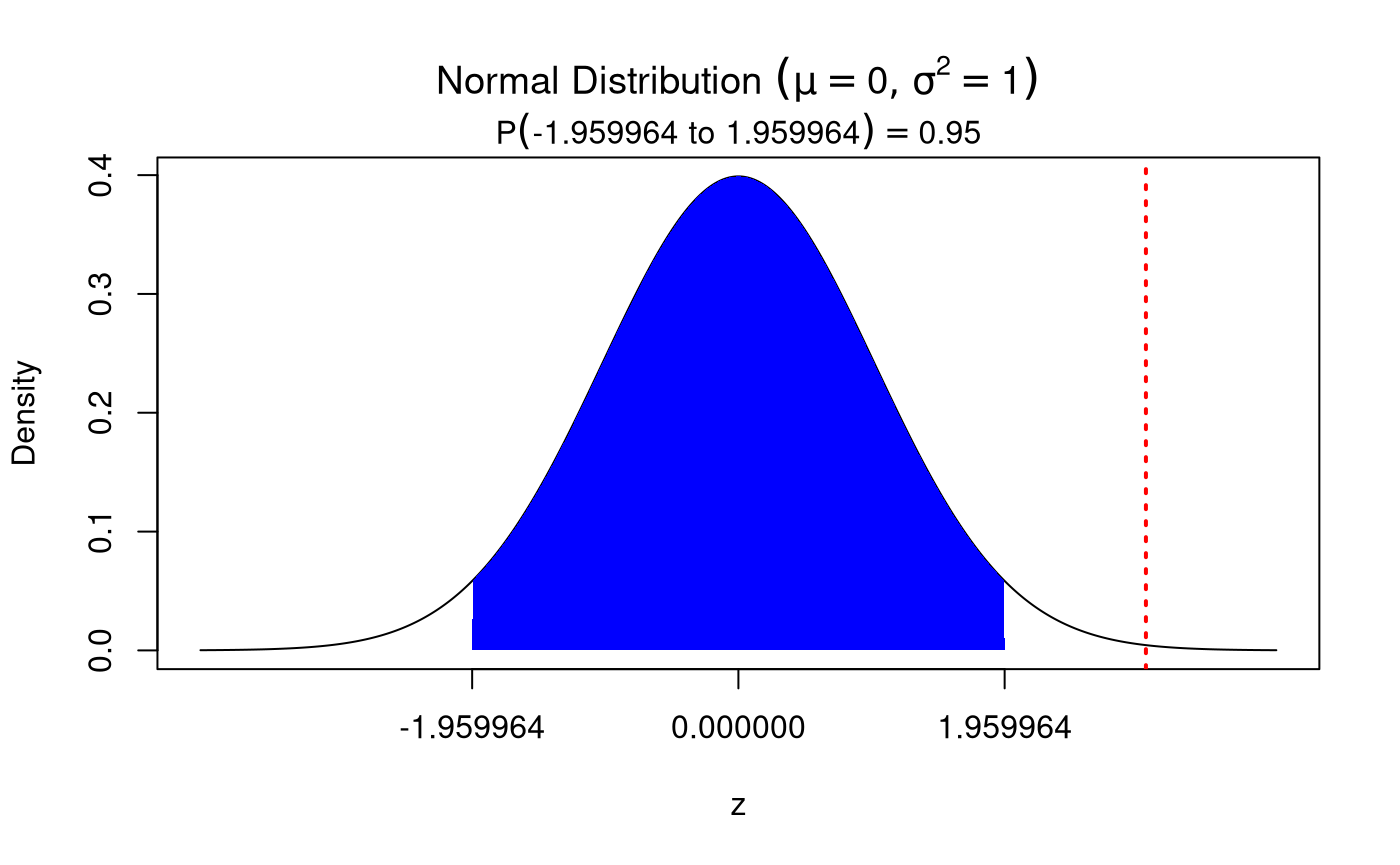
nhstplot(
  alpha = 0.05,
  ci = TRUE,
  dist = "z",
  statistic = 3
)
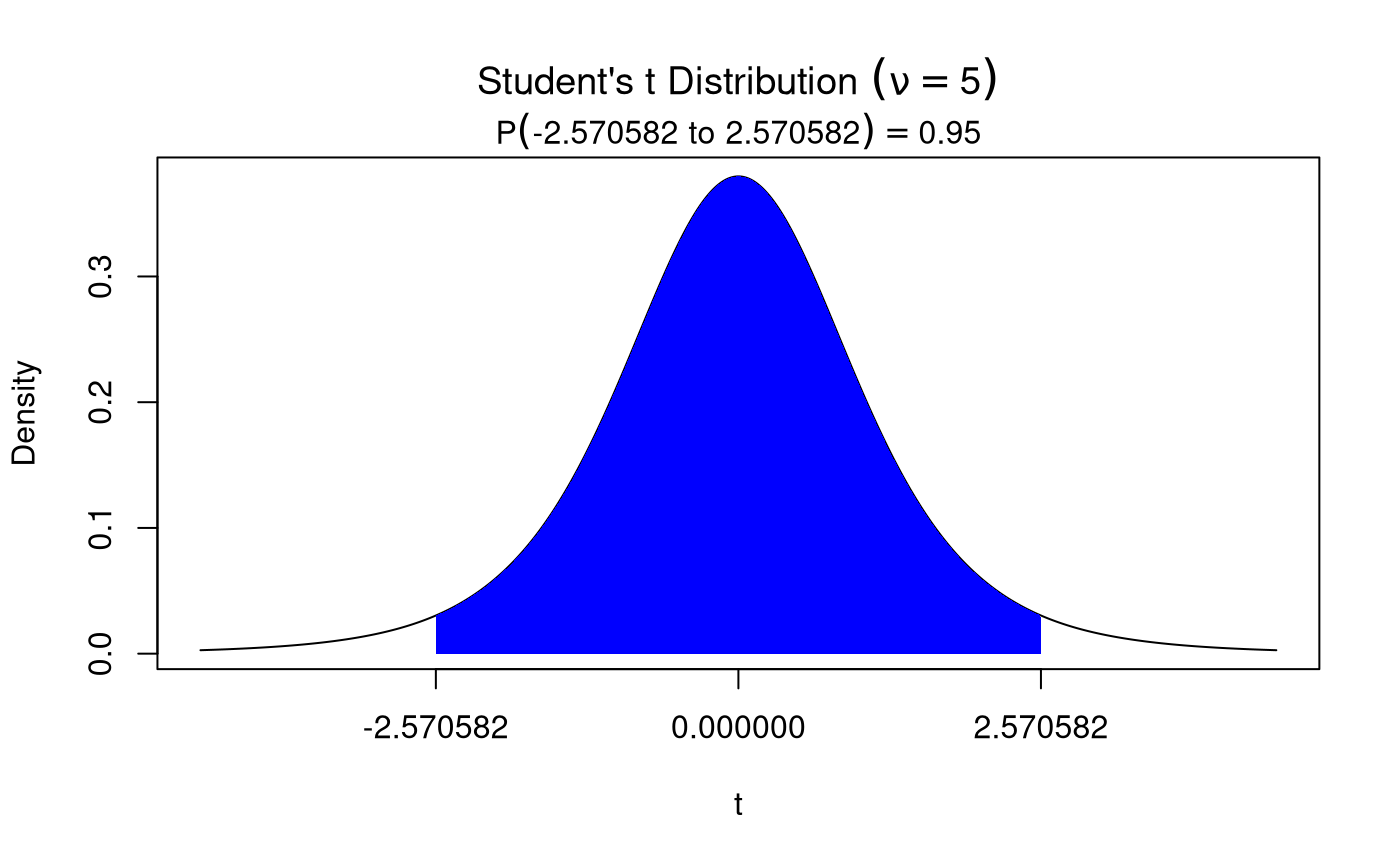
nhstplot(
  alpha = 0.05,
  ci = TRUE,
  dist = "t",
  df = 5
)
One-Tailed
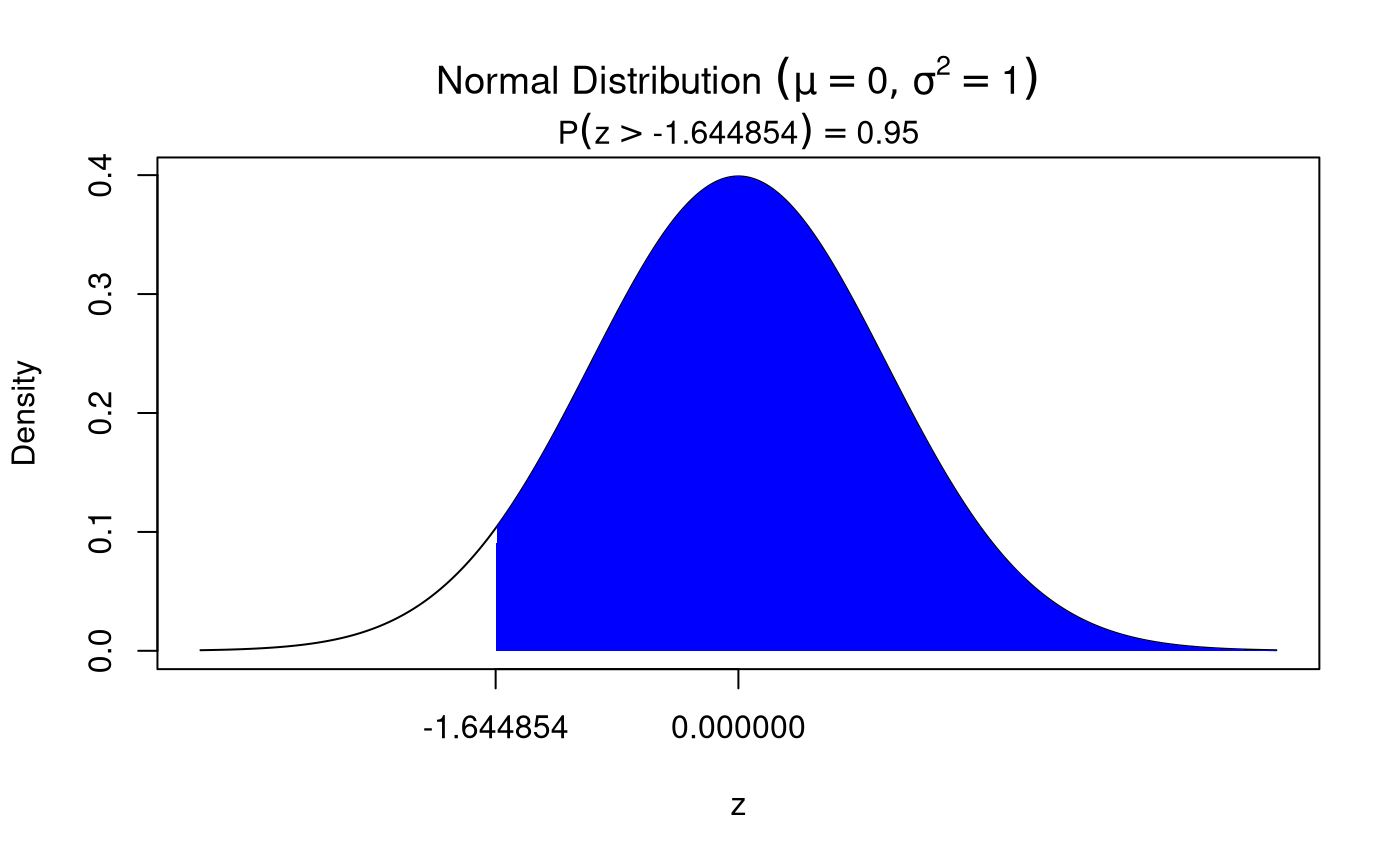
nhstplot(
  alpha = 0.05,
  ci = TRUE,
  two.tailed = FALSE,
  right.tail = TRUE
)
nhstplot(
  alpha = 0.05,
  ci = TRUE,
  two.tailed = FALSE,
  right.tail = FALSE
)
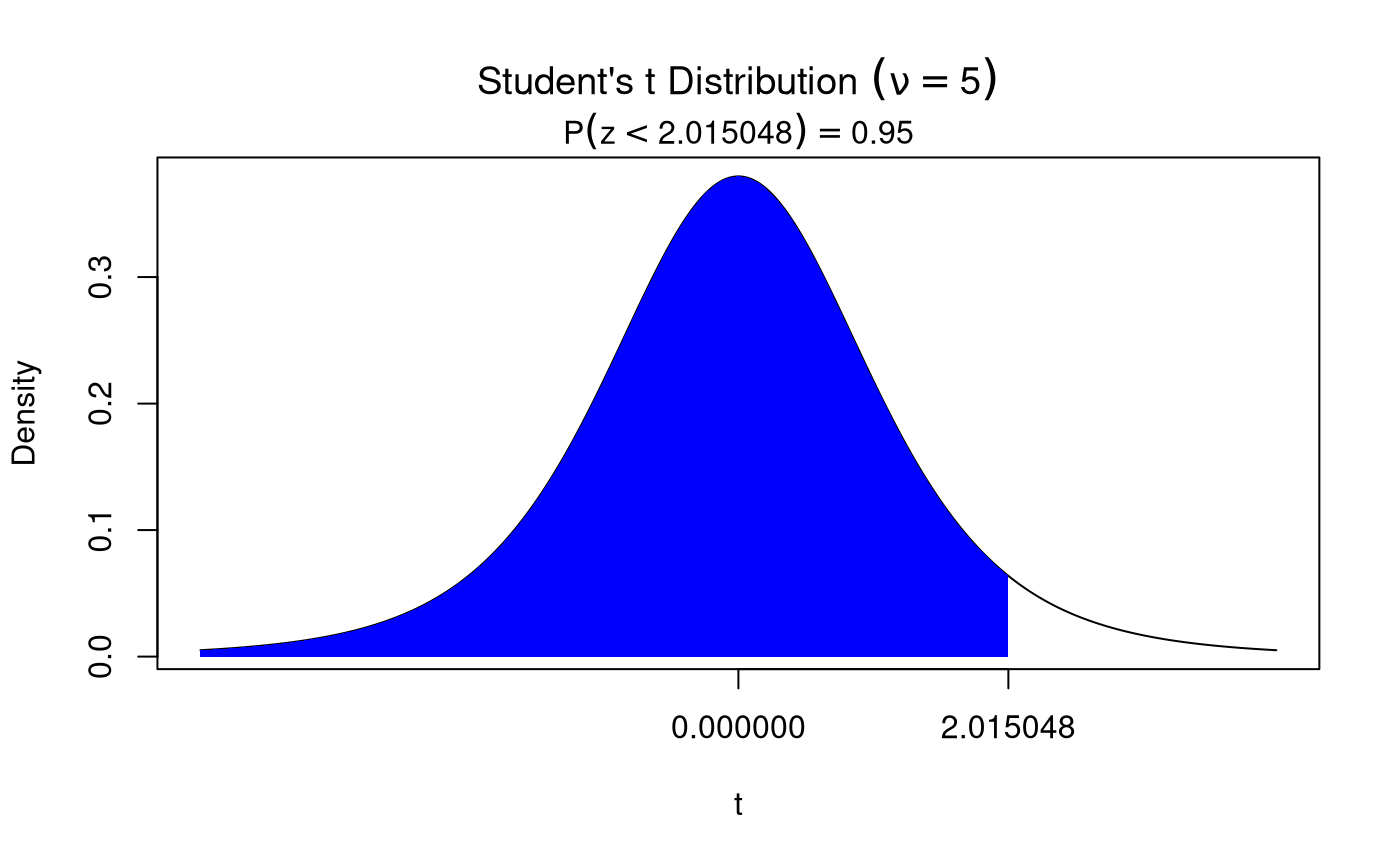
nhstplot(
  alpha = 0.05,
  ci = TRUE,
  dist = "t",
  two.tailed = FALSE,
  right.tail = TRUE,
  df = 5
)
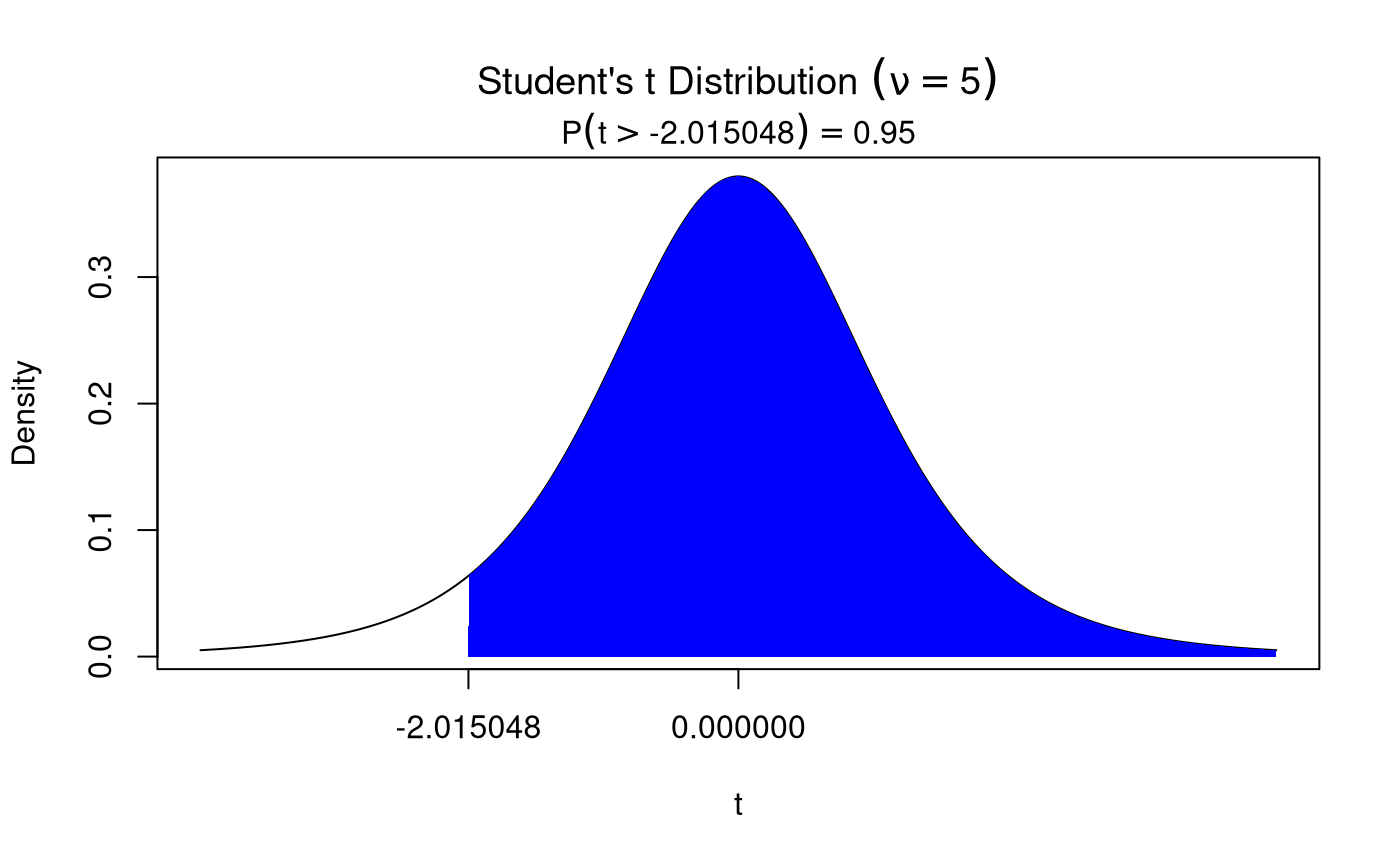
nhstplot(
  alpha = 0.05,
  ci = TRUE,
  dist = "t",
  two.tailed = FALSE,
  right.tail = FALSE,
  df = 5
)
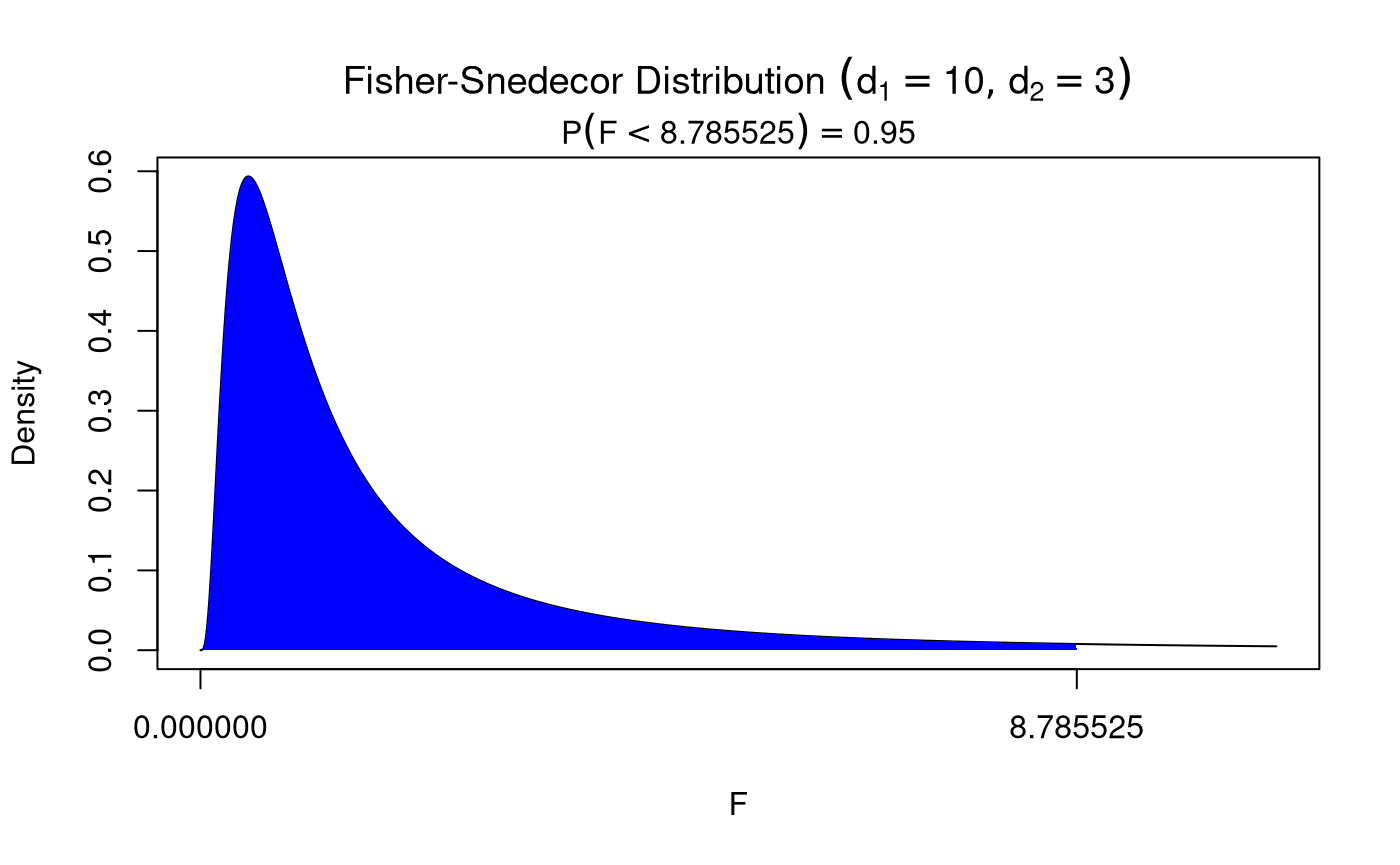
nhstplot(
  alpha = 0.05,
  ci = TRUE,
  dist = "F",
  df1 = 10,
  df2 = 3
)
nhstplot(
  alpha = 0.05,
  ci = TRUE,
  dist = "chisq",
  df = 3
)