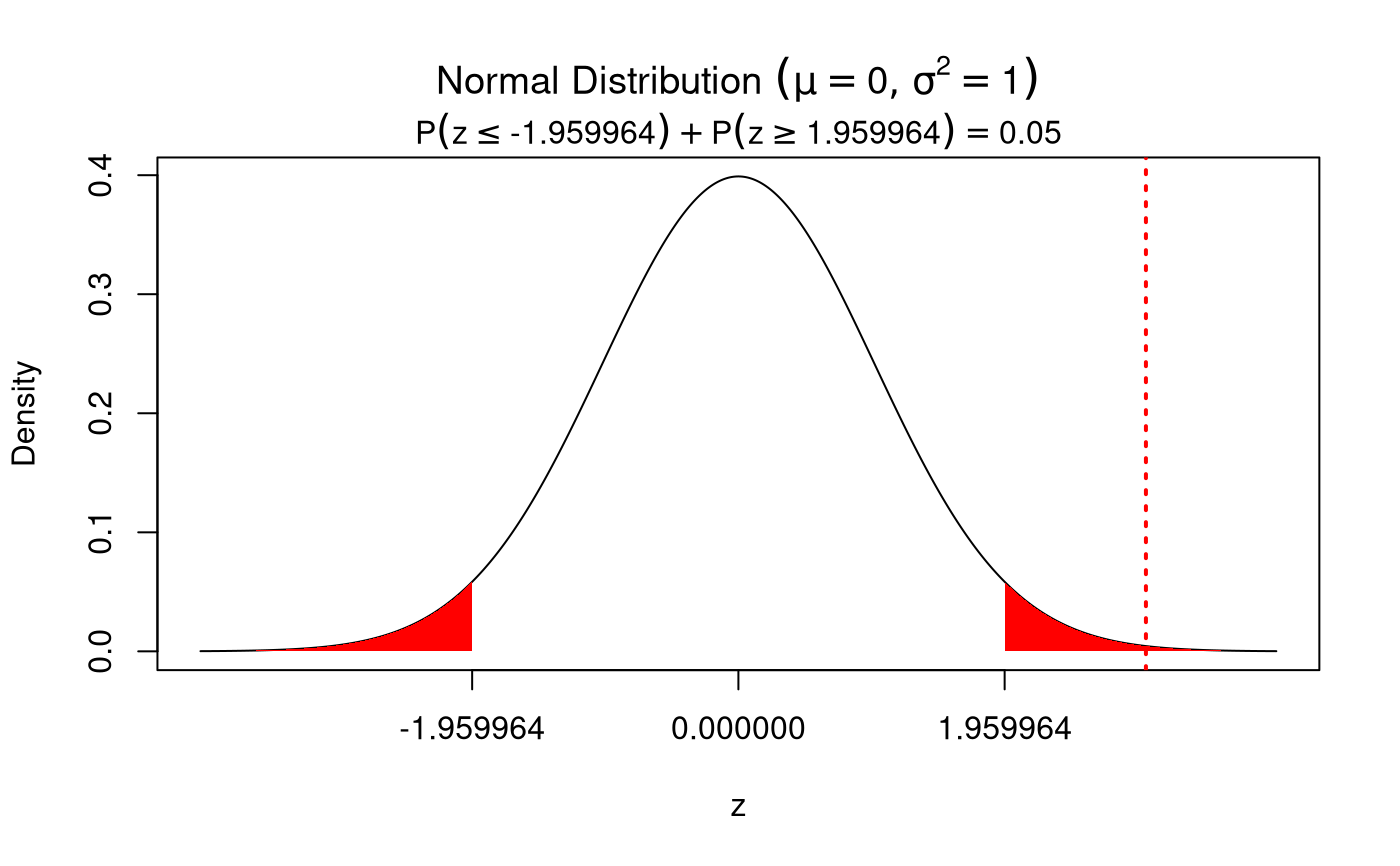
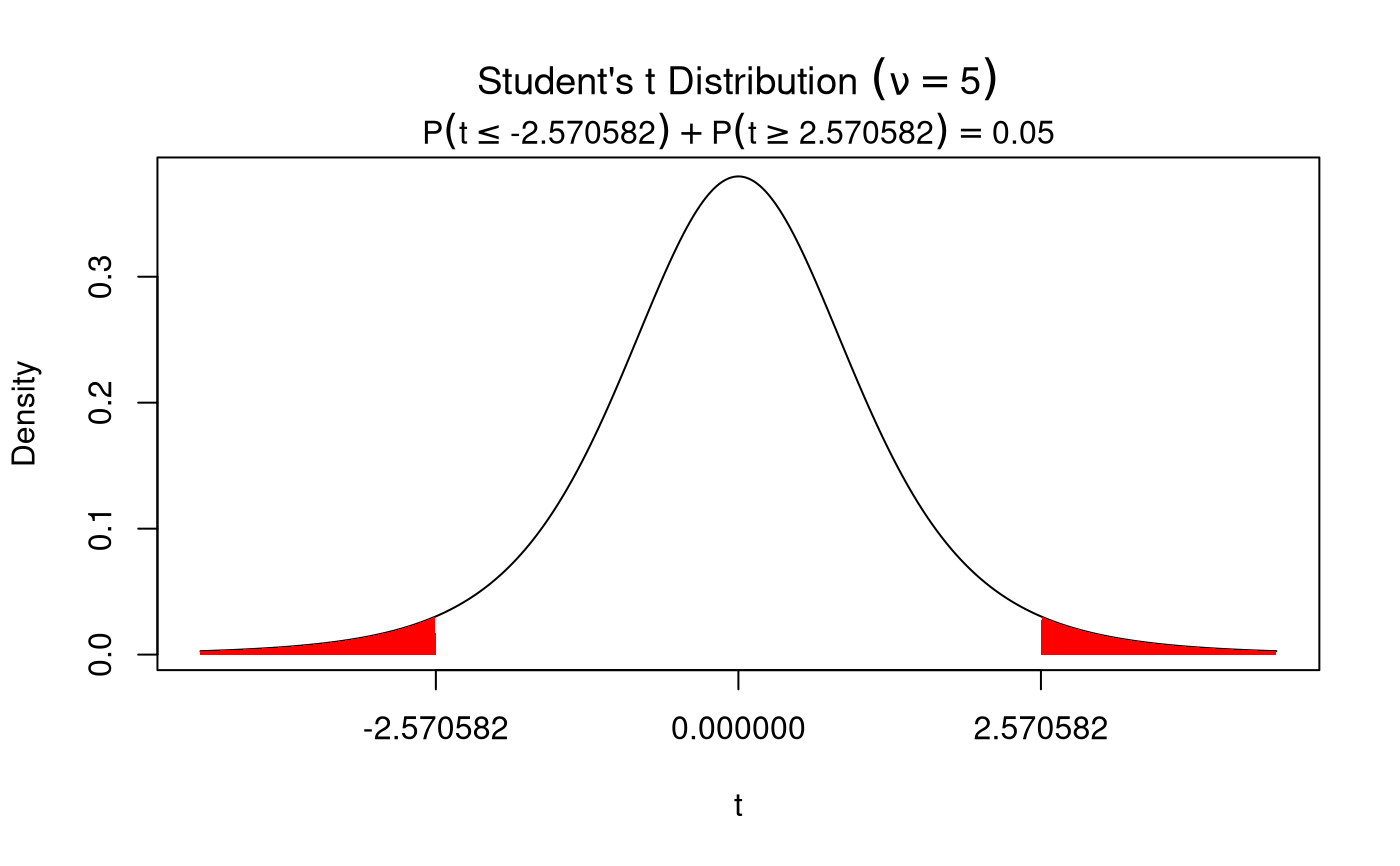
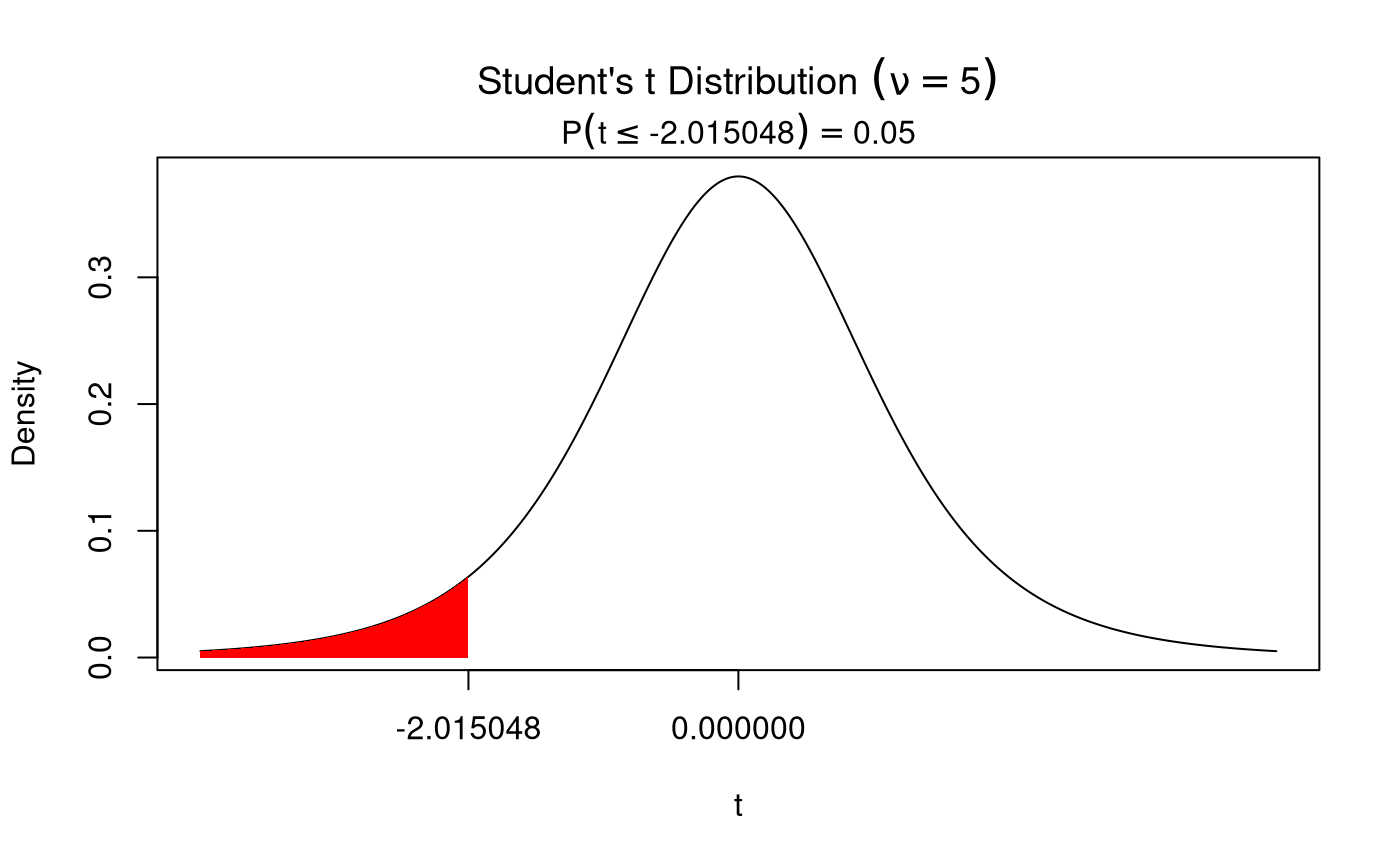
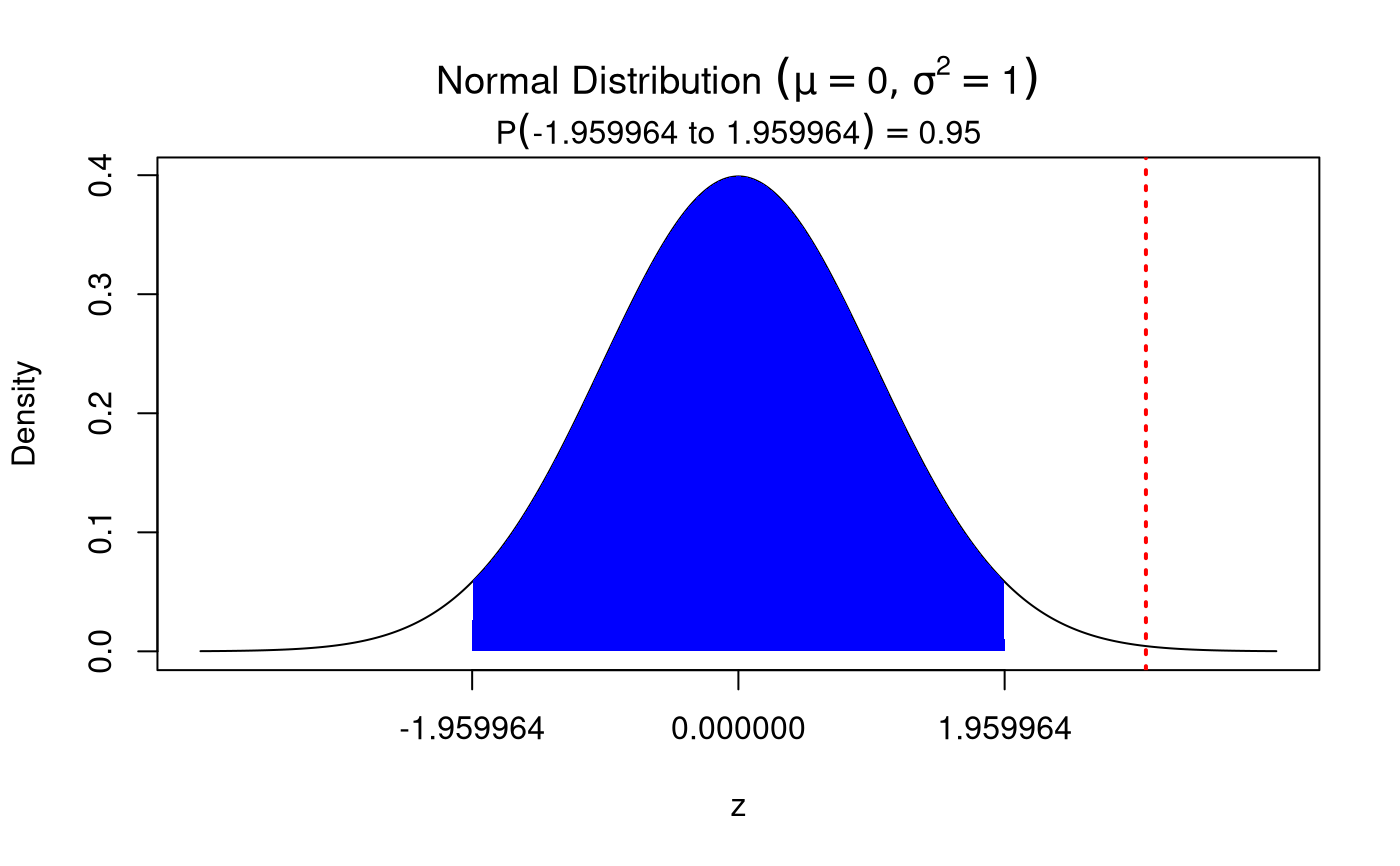
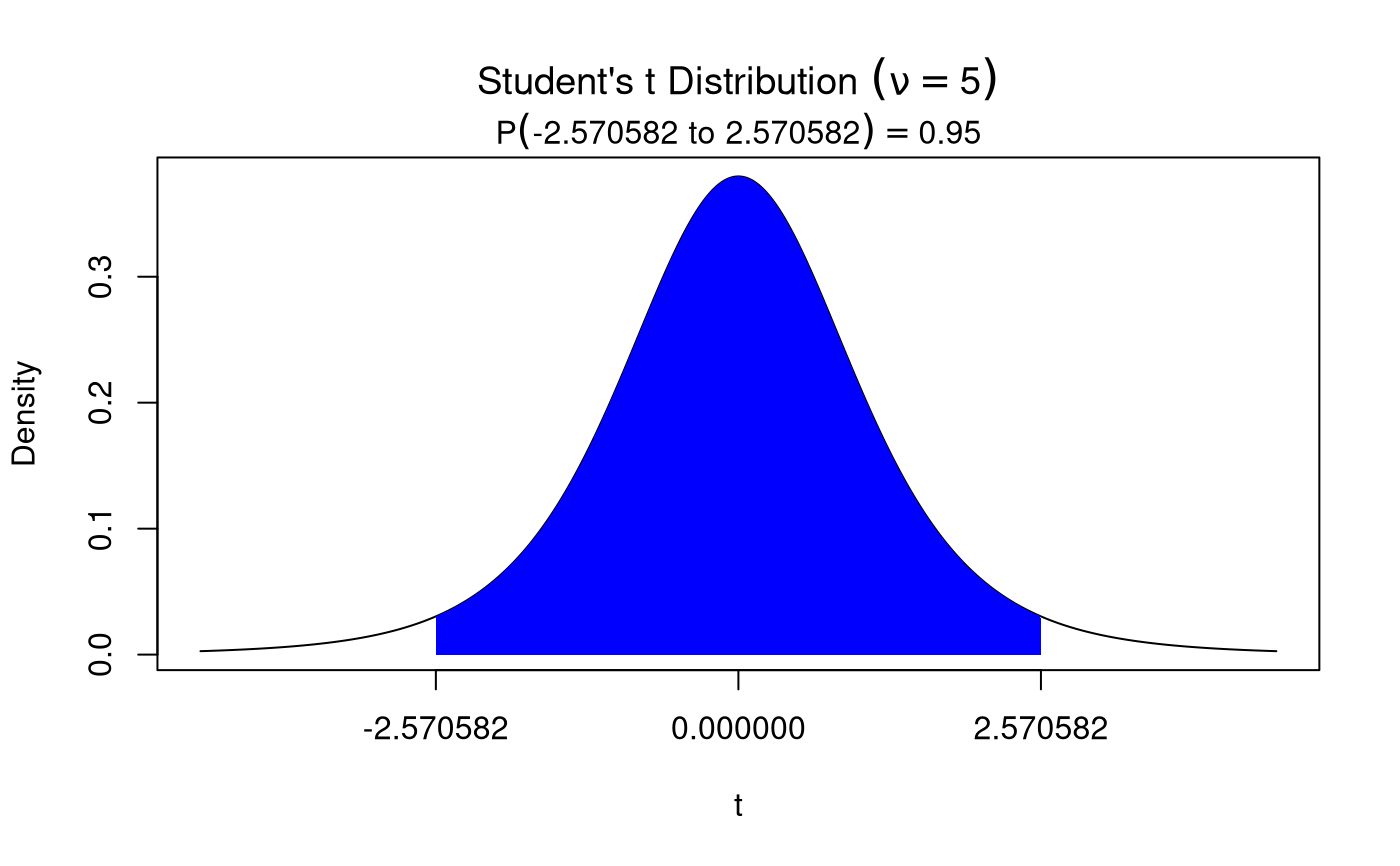
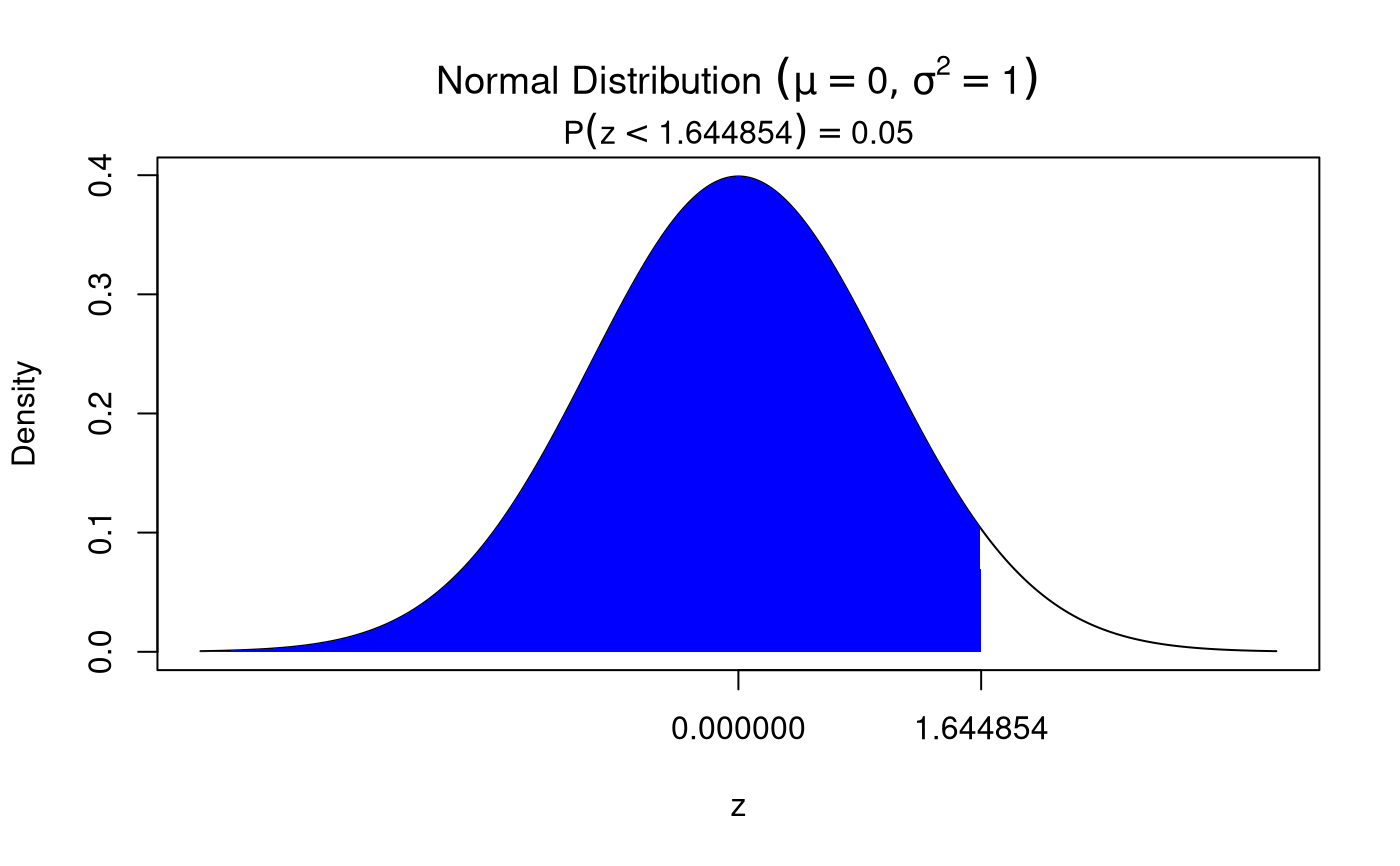
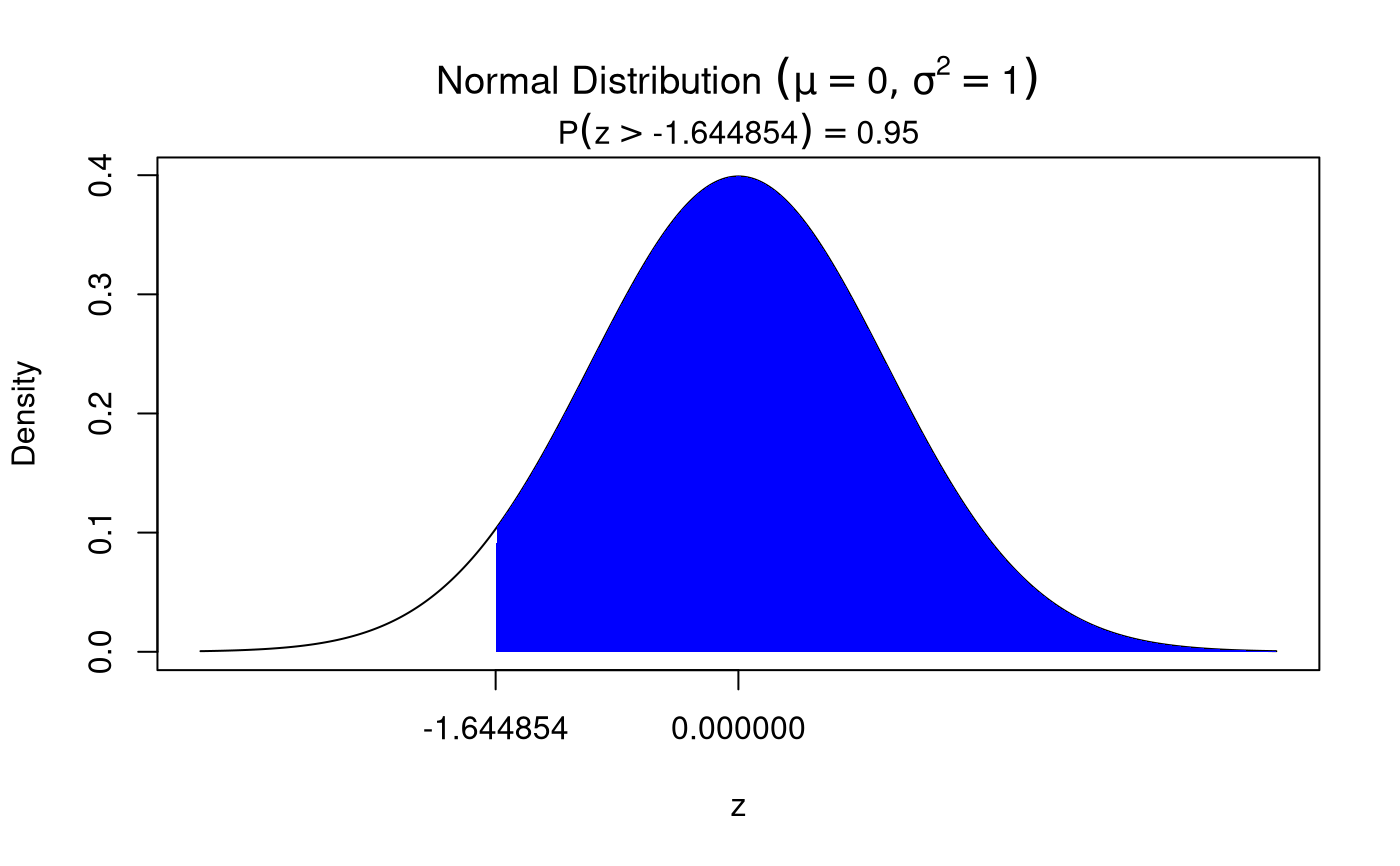
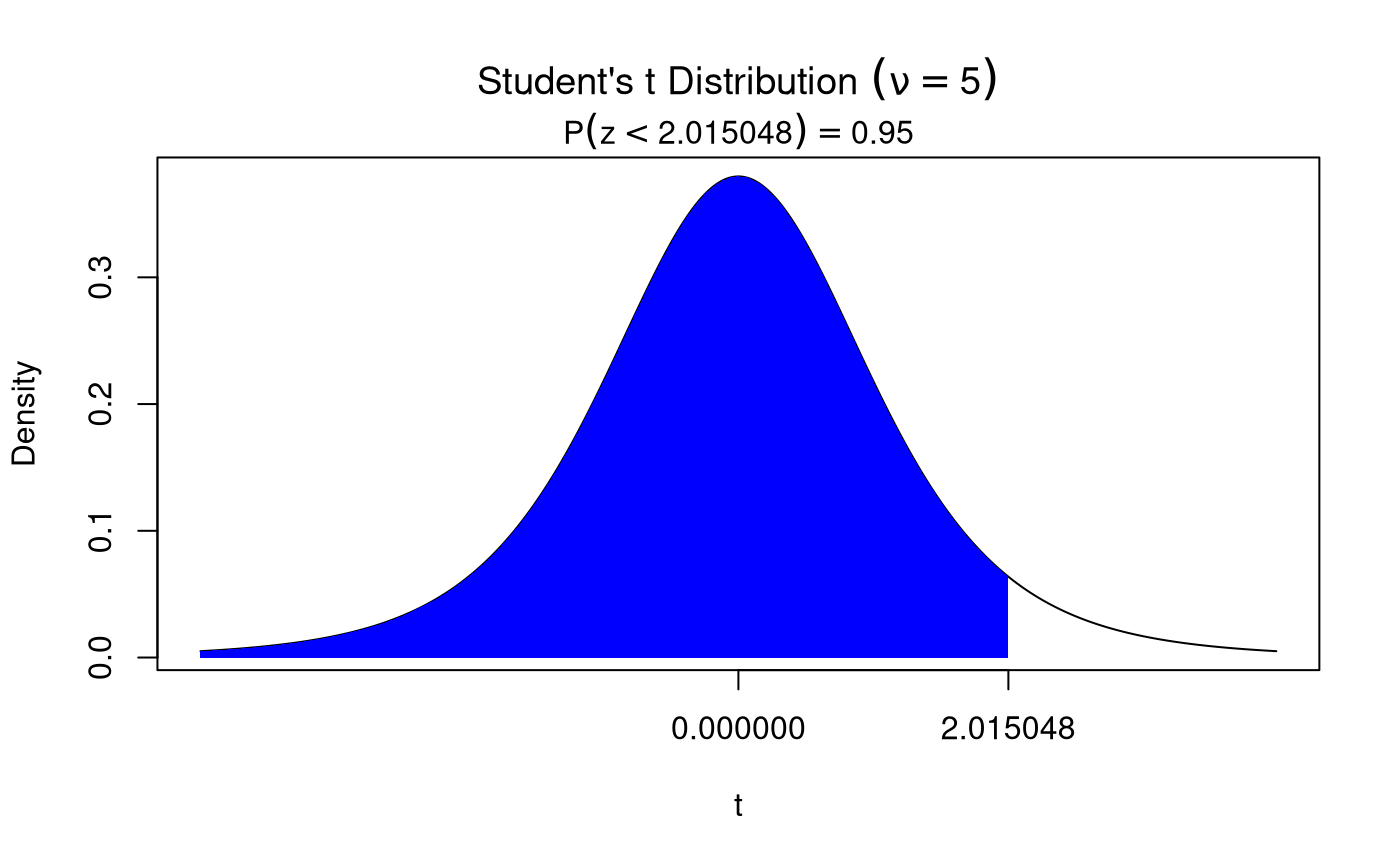
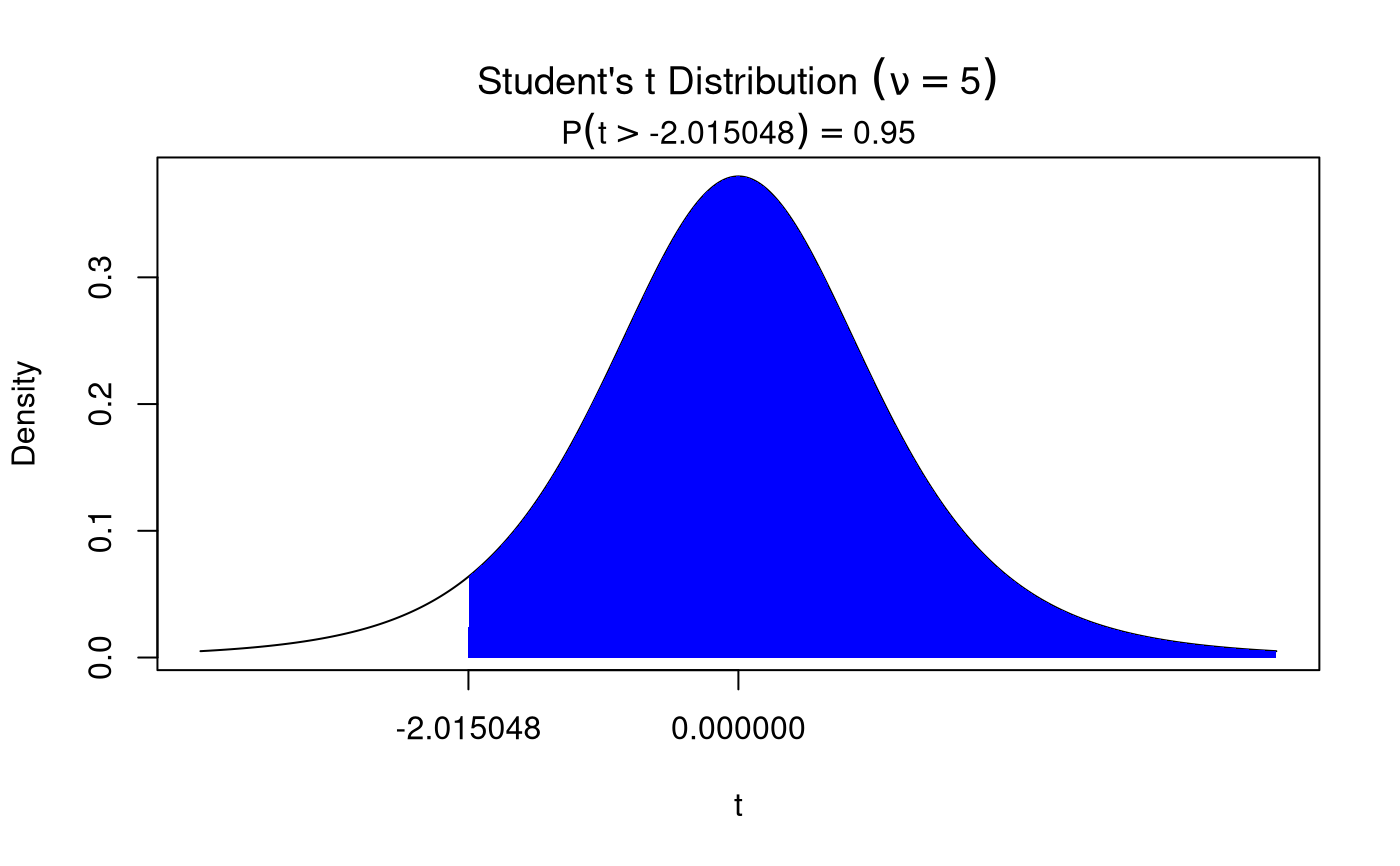
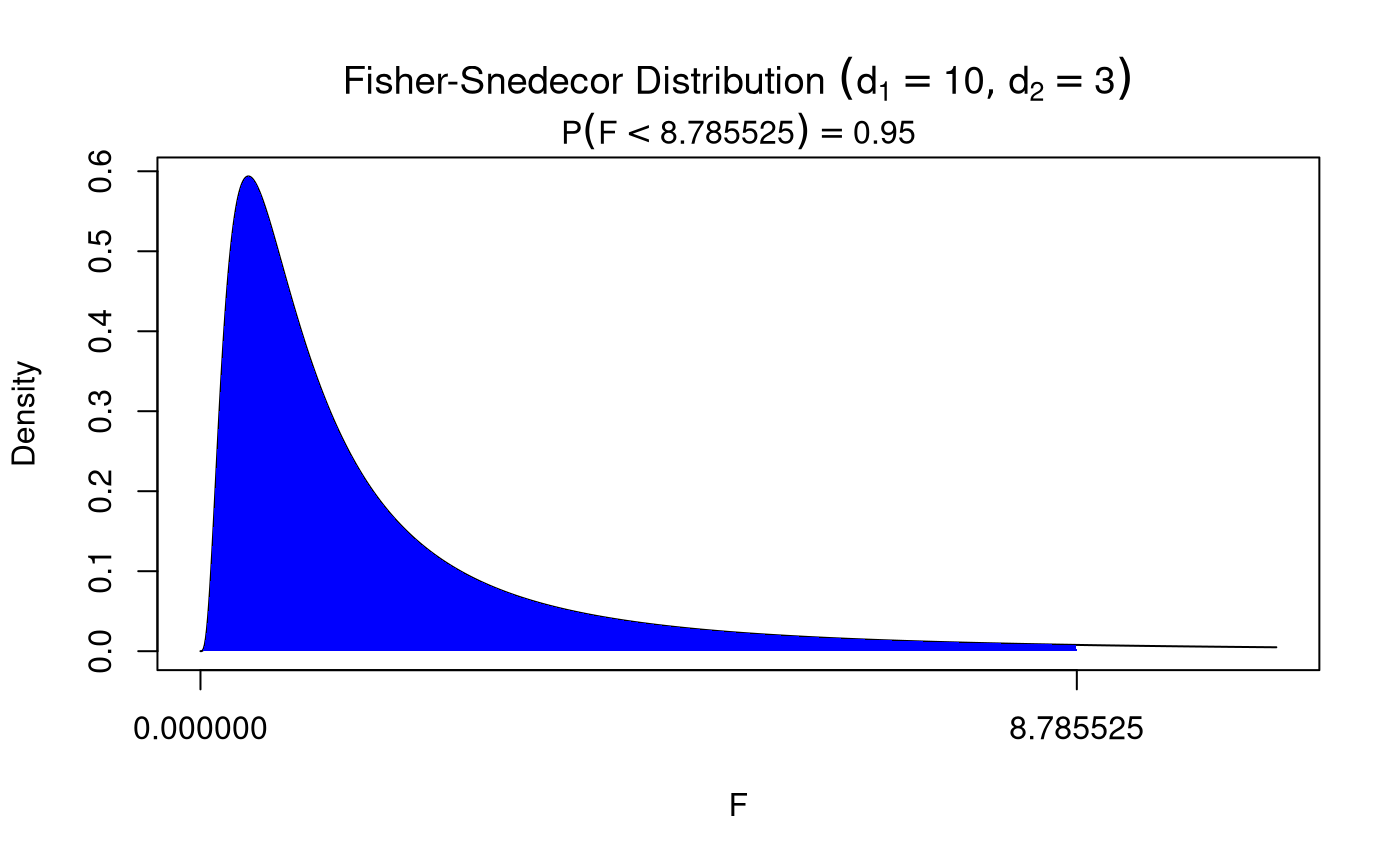
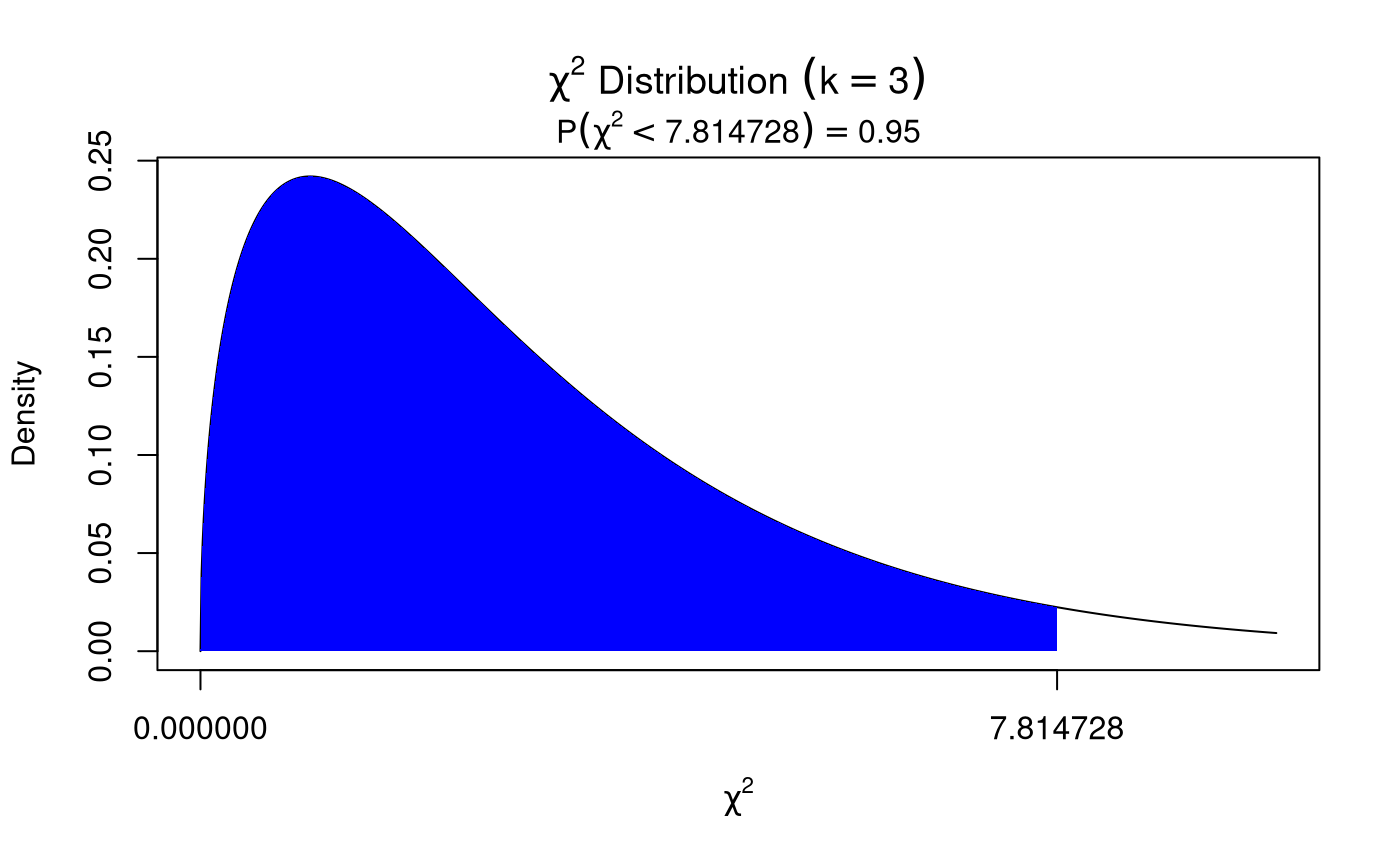
Generates a plot to illustrate null hypothesis significance testing.
nhstplot(
  alpha = 0.05,
  ci = FALSE,
  dist = "z",
  two.tailed = TRUE,
  right.tail = TRUE,
  statistic = NULL,
  ...
)
Arguments
| alpha | Numeric. Significance level \(\left( \alpha \right)\) . |
|---|---|
| ci | Logical.
|
| dist | Character string.
|
| two.tailed | Logical.
If |
| right.tail | Logical.
If |
| statistic | Numeric. Test statistic. This is an optional argument. |
| ... | Degrees of freedom.
|
See also
Other alpha functions:
alpha2crit(),
alpha2prob(),
ci2crit(),
ci2prob()
Examples
# ci = FALSE
# two-tailed
nhstplot(
  alpha = 0.05,
  dist = "z",
  statistic = 3
)nhstplot(
  alpha = 0.05,
  dist = "t",
  df = 5
)# one-tailed
nhstplot(
  alpha = 0.05,
  two.tailed = FALSE,
  right.tail = TRUE
)nhstplot(
  alpha = 0.05,
  two.tailed = FALSE,
  right.tail = FALSE
)nhstplot(
  alpha = 0.05,
  dist = "t",
  two.tailed = FALSE,
  right.tail = TRUE,
  df = 5
)nhstplot(
  alpha = 0.05,
  dist = "t",
  two.tailed = FALSE,
  right.tail = FALSE,
  df = 5
)nhstplot(
  alpha = 0.05,
  dist = "F",
  df1 = 10,
  df2 = 3
)nhstplot(
  alpha = 0.05,
  dist = "chisq",
  df = 3
)# ci = TRUE
# two-tailed
nhstplot(
  alpha = 0.05,
  ci = TRUE,
  dist = "z",
  statistic = 3
)nhstplot(
  alpha = 0.05,
  ci = TRUE,
  dist = "t",
  df = 5
)# one-tailed
nhstplot(
  alpha = 0.05,
  ci = TRUE,
  two.tailed = FALSE,
  right.tail = TRUE
)nhstplot(
  alpha = 0.05,
  ci = TRUE,
  two.tailed = FALSE,
  right.tail = FALSE
)nhstplot(
  alpha = 0.05,
  ci = TRUE,
  dist = "t",
  two.tailed = FALSE,
  right.tail = TRUE,
  df = 5
)nhstplot(
  alpha = 0.05,
  ci = TRUE,
  dist = "t",
  two.tailed = FALSE,
  right.tail = FALSE,
  df = 5
)nhstplot(
  alpha = 0.05,
  ci = TRUE,
  dist = "F",
  df1 = 10,
  df2 = 3
)nhstplot(
  alpha = 0.05,
  ci = TRUE,
  dist = "chisq",
  df = 3
)