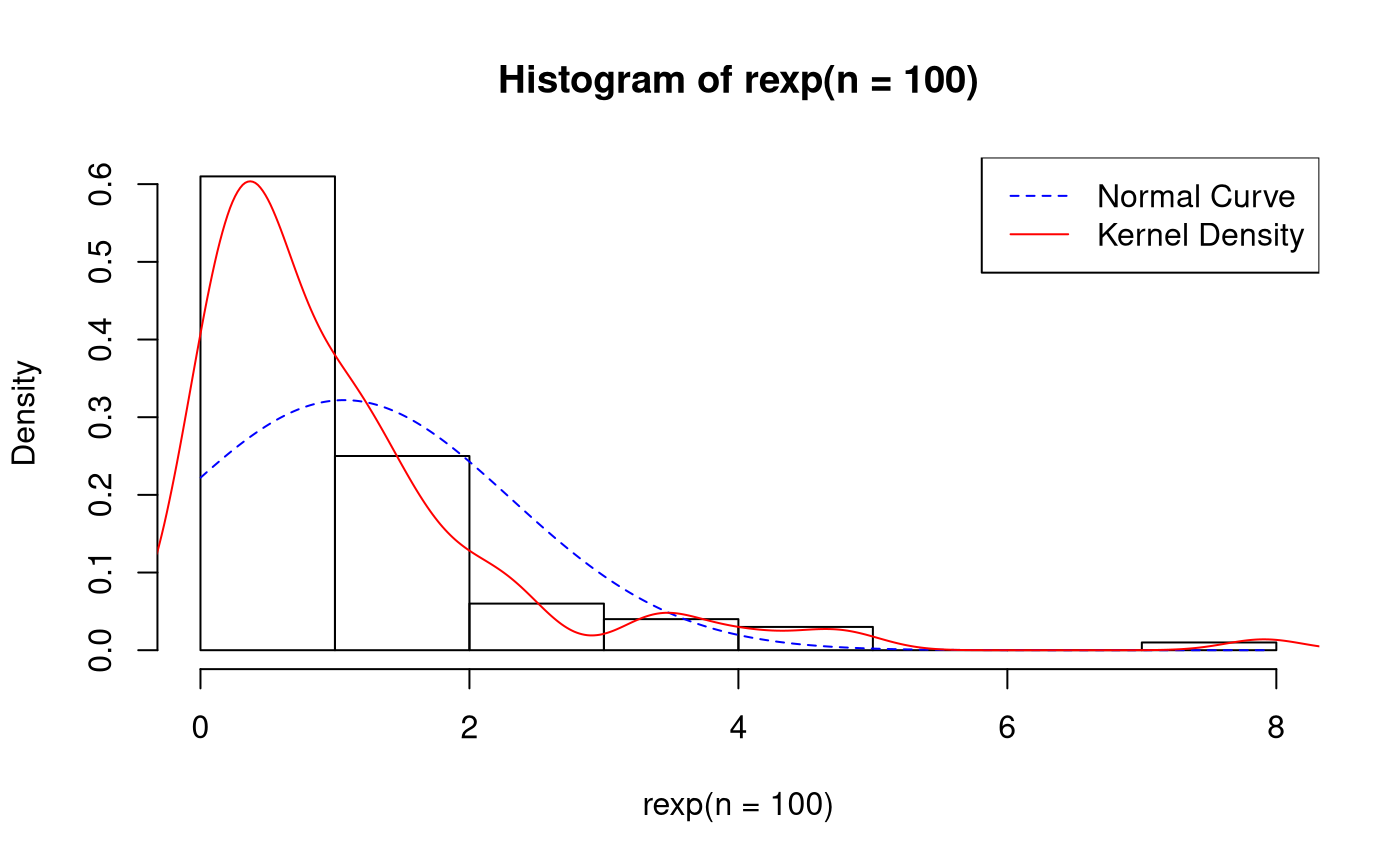
With Normal Curve, Kernel Density Plot, and Legend
expect_error(
  object = .hist.plot(
    x = rnorm(n = 100, mean = 100, sd = 15)
  ),
  regexp = NA
)
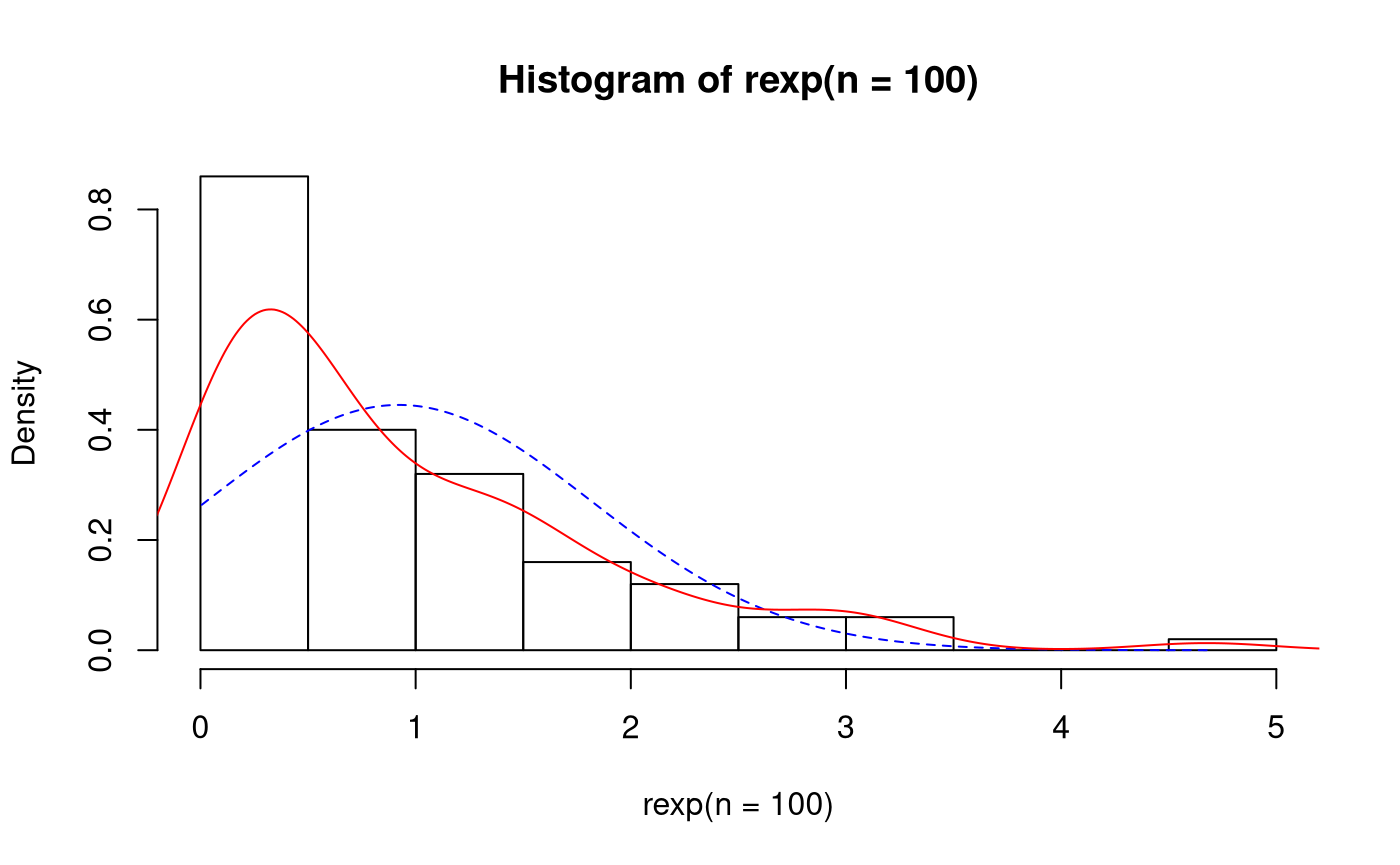
With Normal Curve, and Kernel Density Plot
expect_error(
  object = .hist.plot(
    x = rnorm(n = 100, mean = 100, sd = 15),
    legend = FALSE
  ),
  regexp = NA
)
expect_error(
  object = .hist.plot(
    x = rexp(n = 100),
    legend = FALSE
  ),
  regexp = NA
)
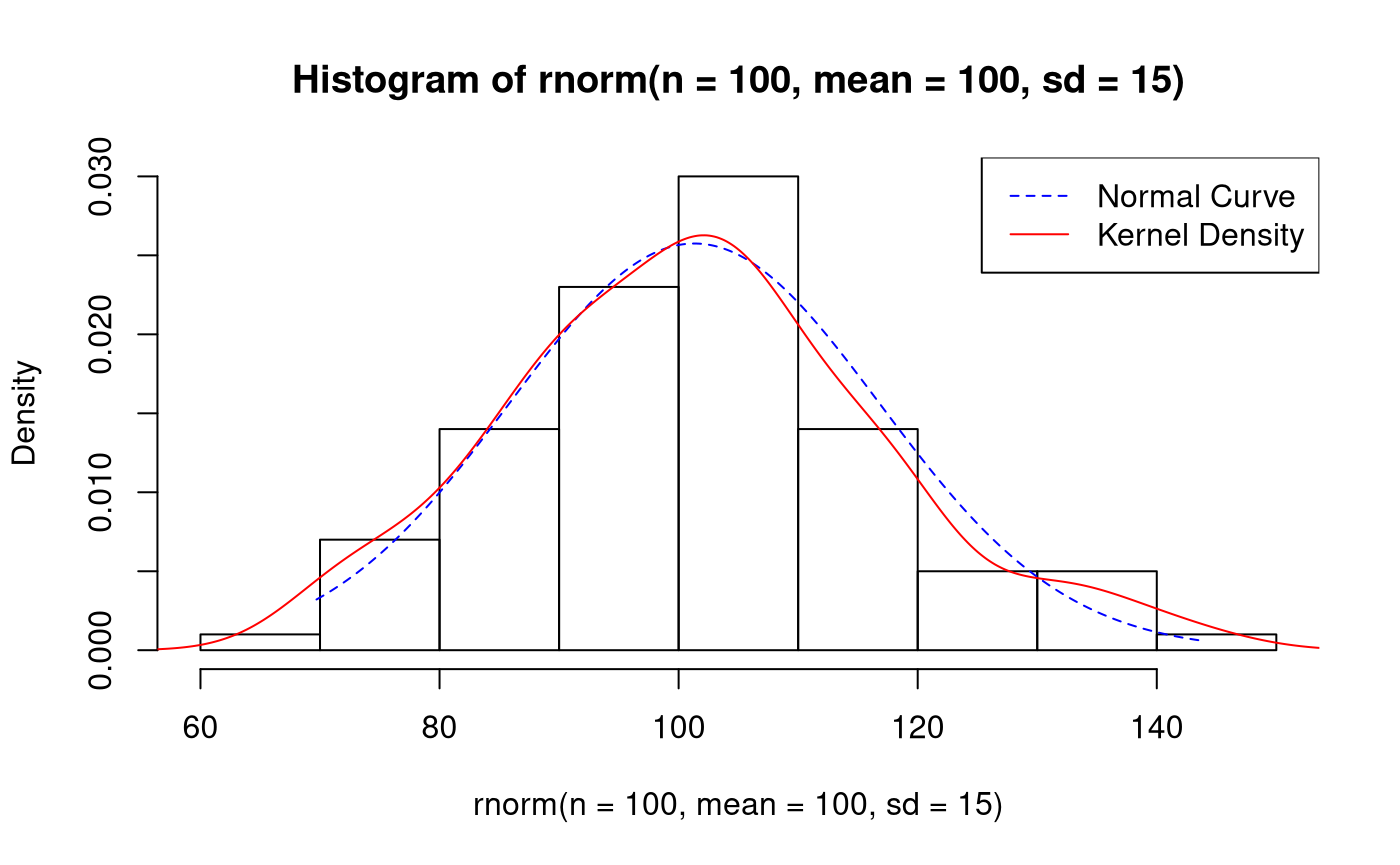
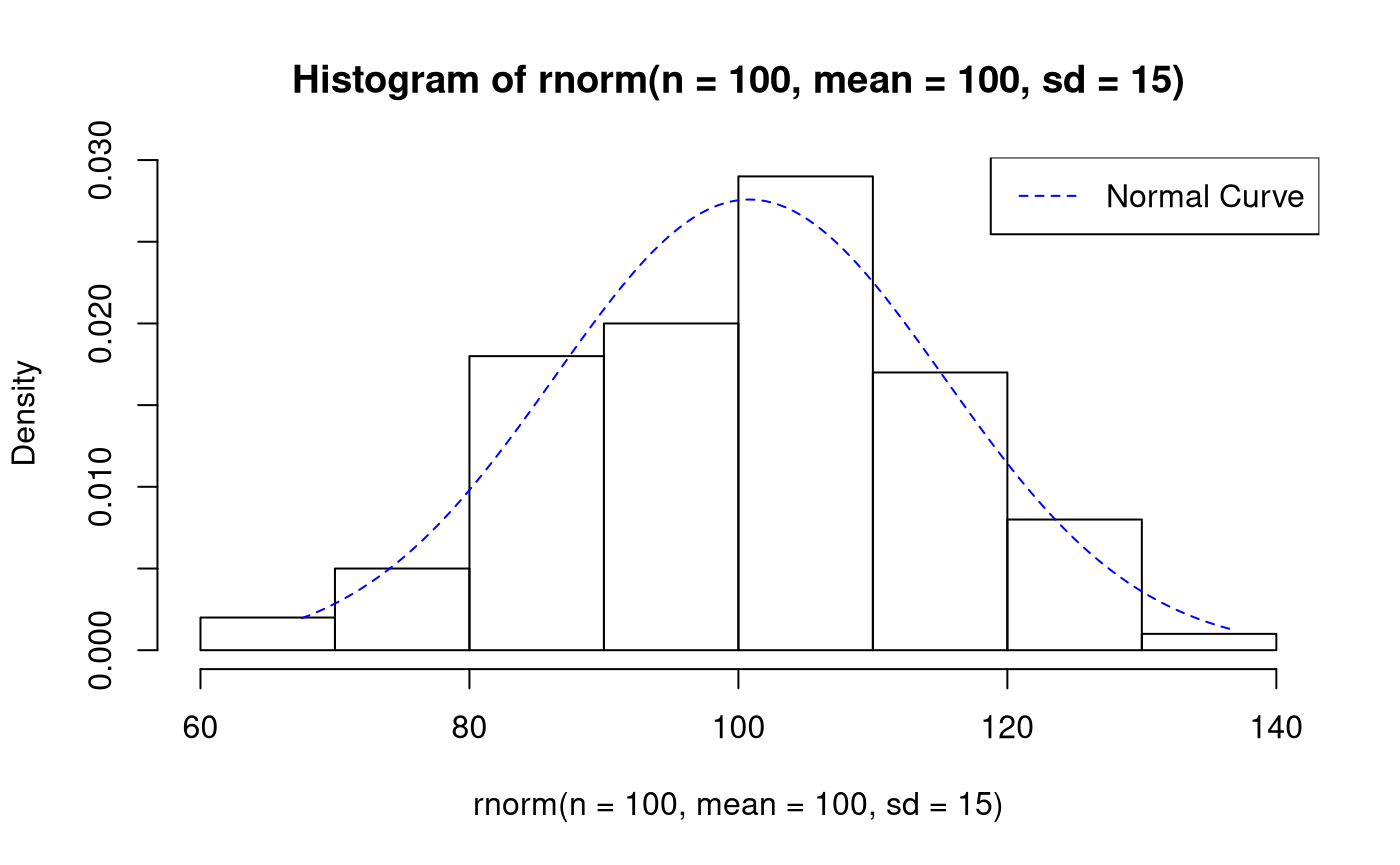
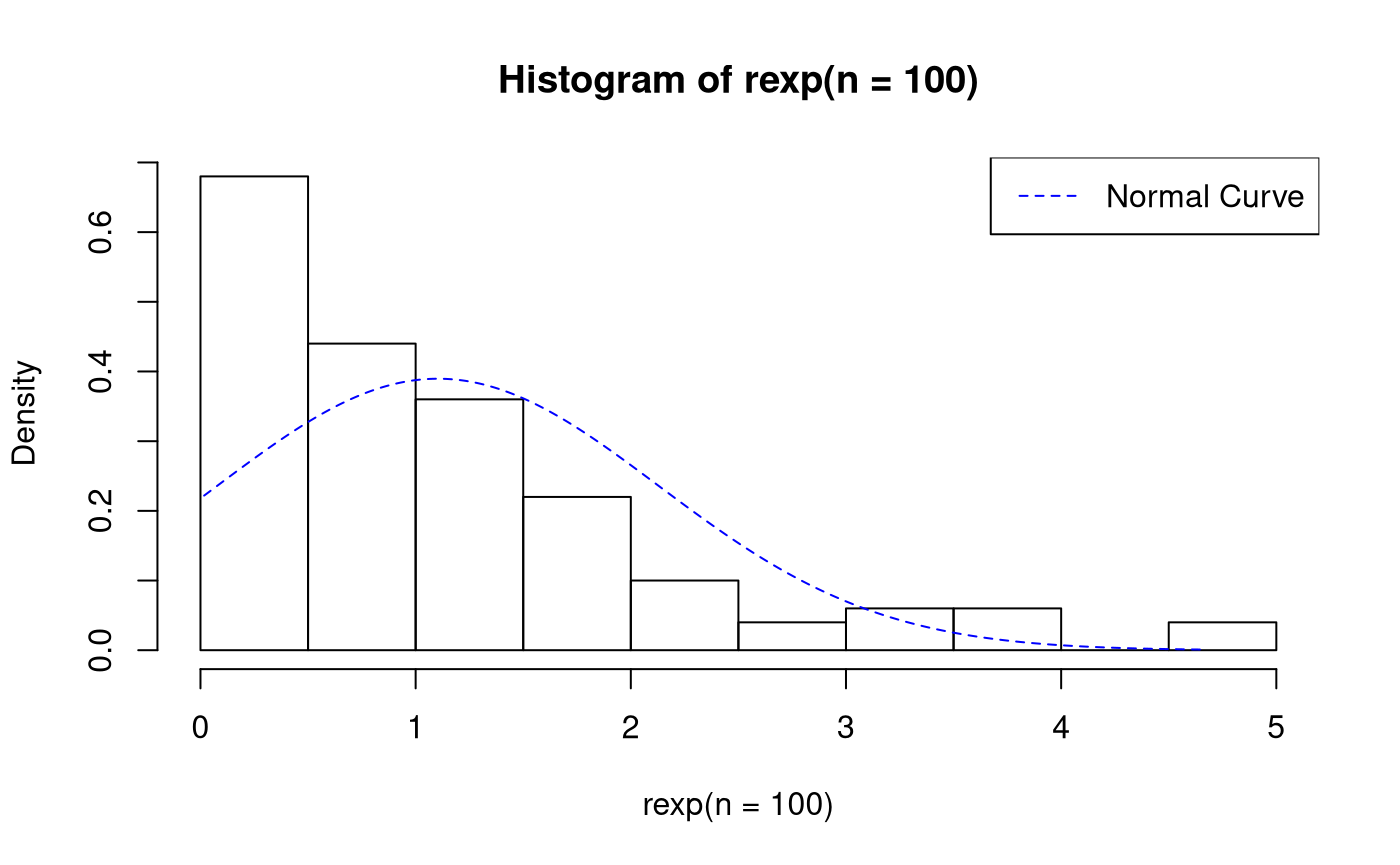
With Normal Curve, and Legend
expect_error(
  object = .hist.plot(
    x = rnorm(n = 100, mean = 100, sd = 15),
    kernel = FALSE
  ),
  regexp = NA
)
expect_error(
  object = .hist.plot(
    x = rexp(n = 100),
    kernel = FALSE
  ),
  regexp = NA
)
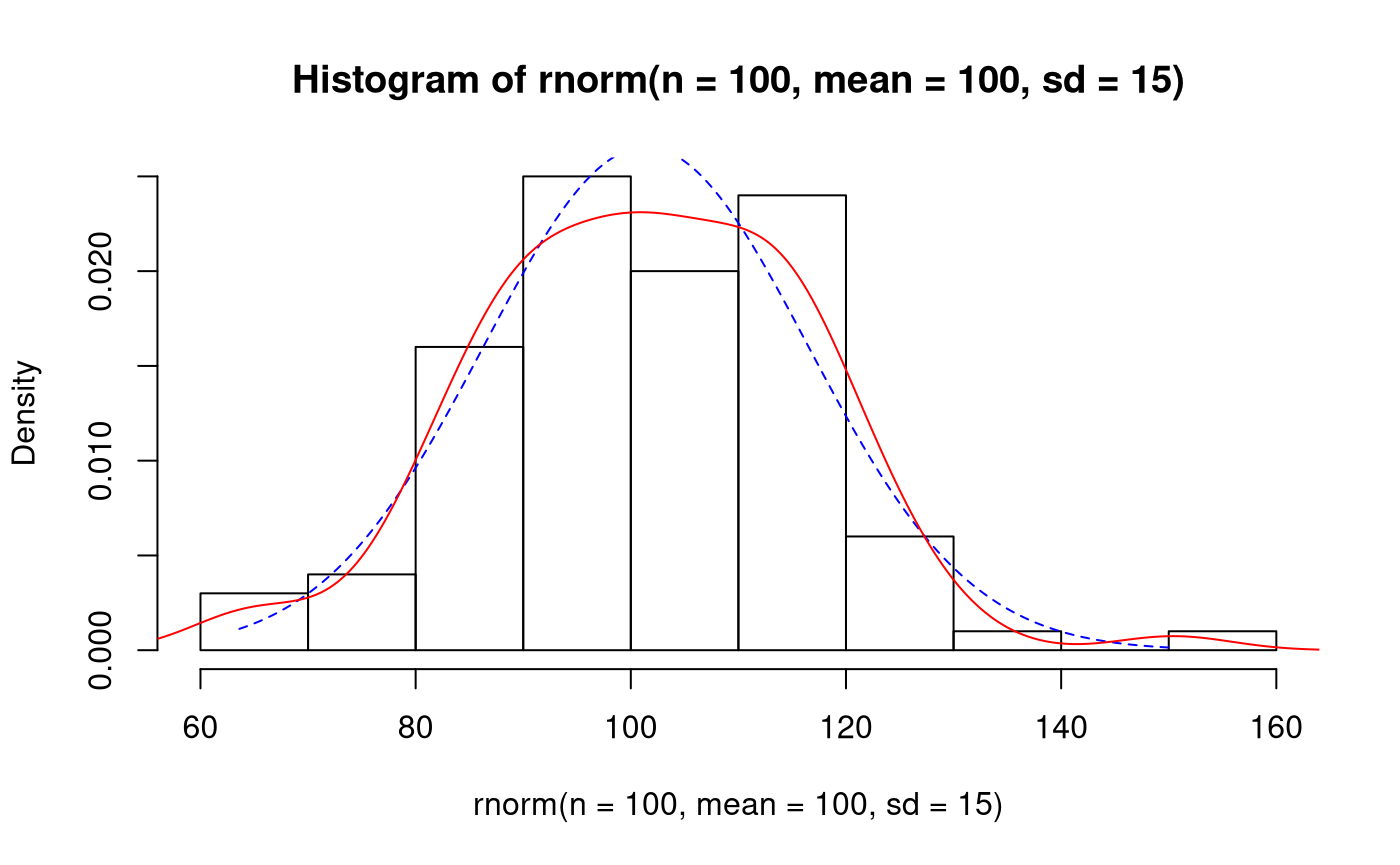
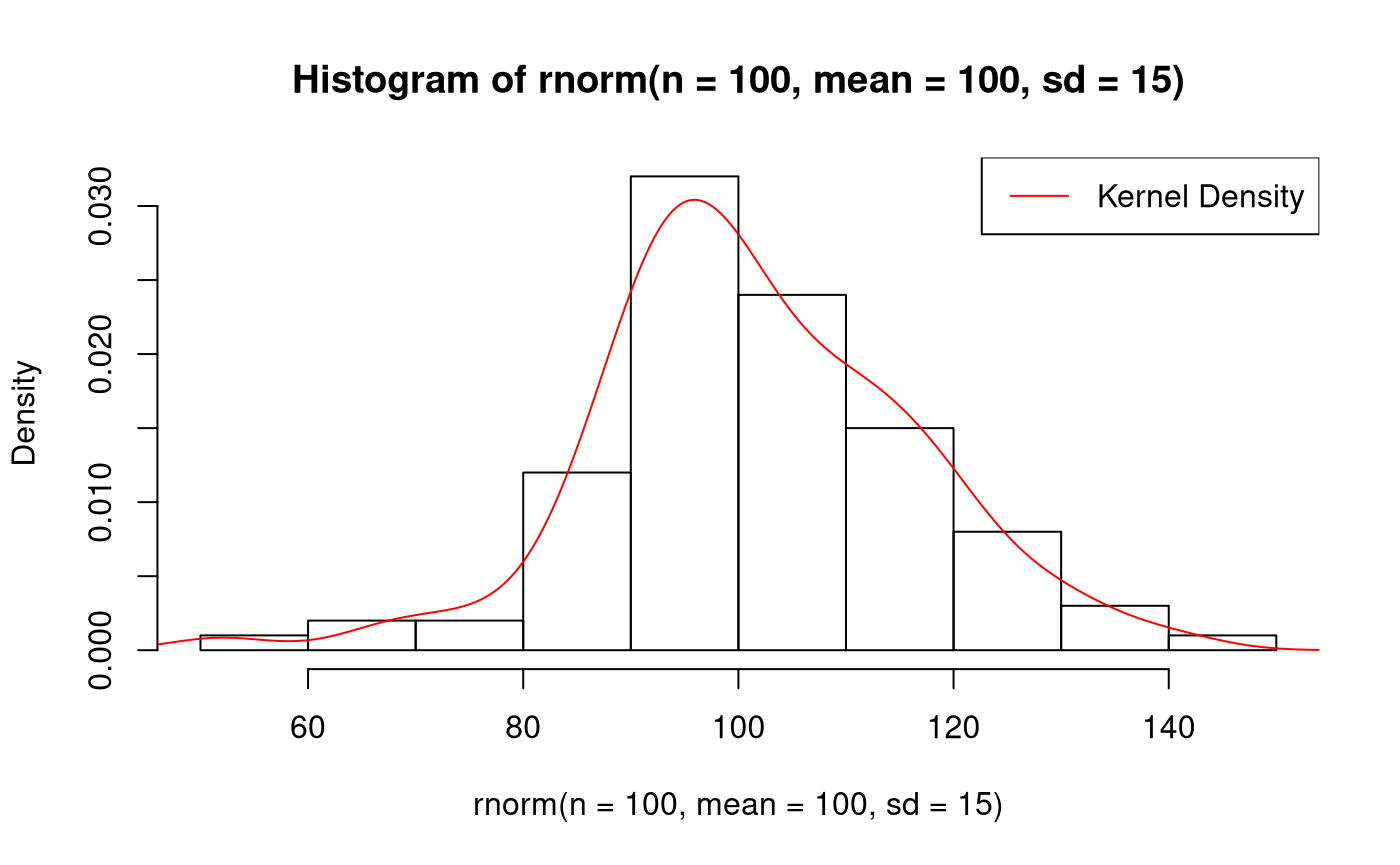
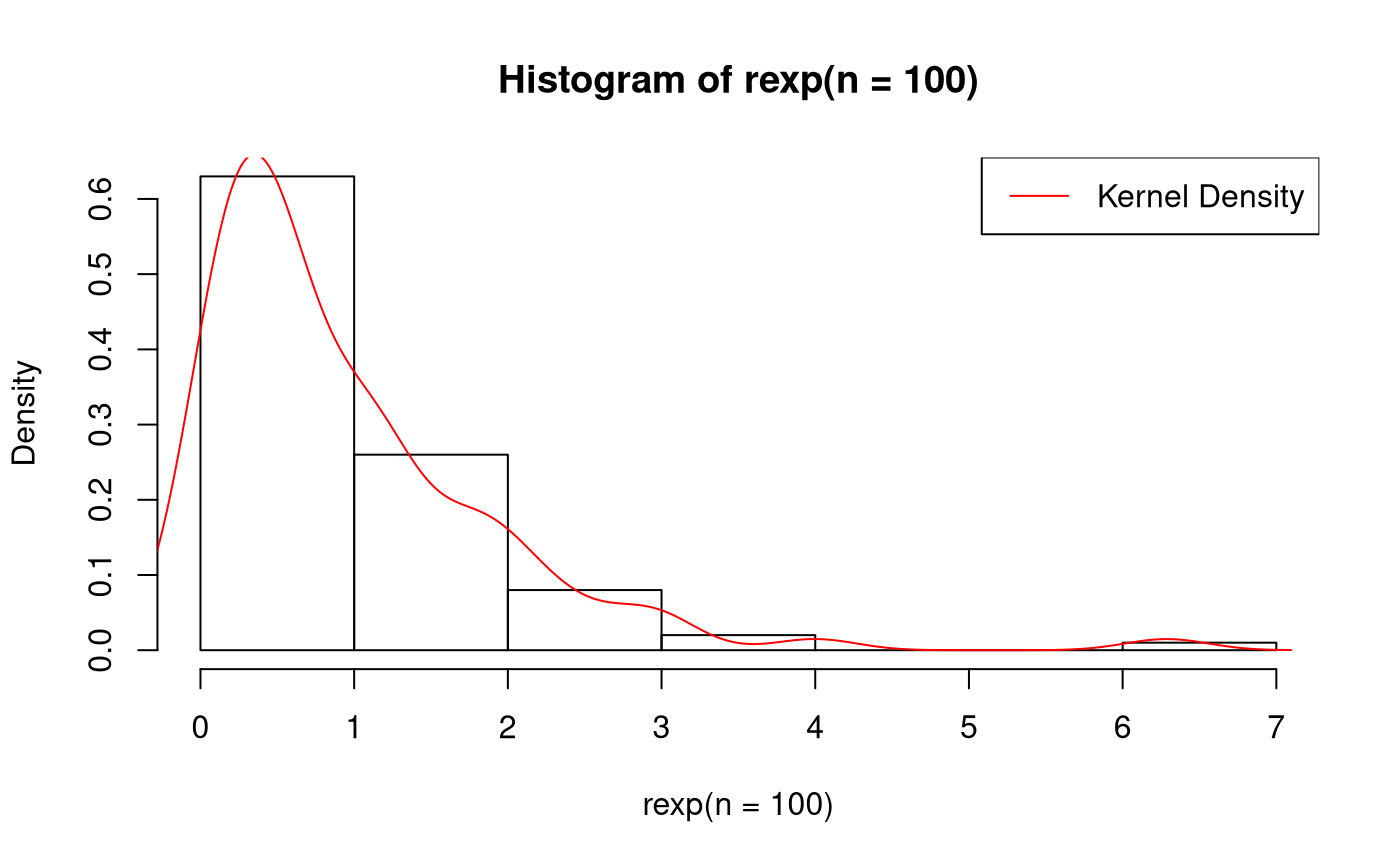
With Kernel Density Plot, and Legend
expect_error(
  object = .hist.plot(
    x = rnorm(n = 100, mean = 100, sd = 15),
    normalcurve = FALSE
  ),
  regexp = NA
)
expect_error(
  object = .hist.plot(
    x = rexp(n = 100),
    normalcurve = FALSE
  ),
  regexp = NA
)
plot = FALSE
expect_error(
  object = .hist.plot(
    x = rexp(n = 100),
    plot = FALSE
  ),
  regexp = NA
)
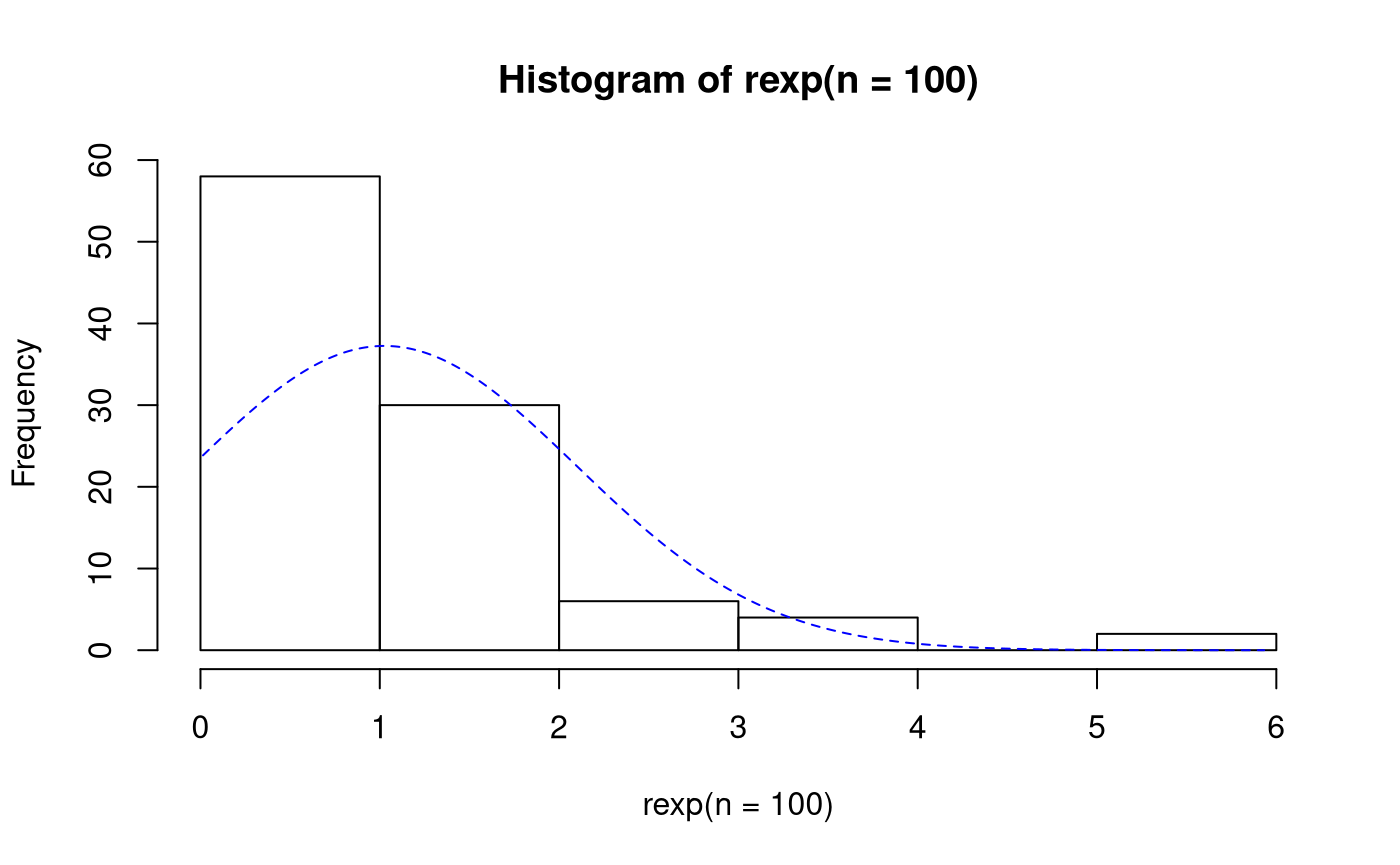
freq = TRUE
expect_error(
  object = .hist.plot(
    x = rexp(n = 100),
    freq = TRUE
  ),
  regexp = NA
)