Tests: The Linear Regression Model (Plots)
Ivan Jacob Agaloos Pesigan
2020-12-31
Source:vignettes/tests/test-linreg-plot.Rmd
test-linreg-plot.Rmd
# The Linear Regression Model (Plots) {#linreg-plots}Data
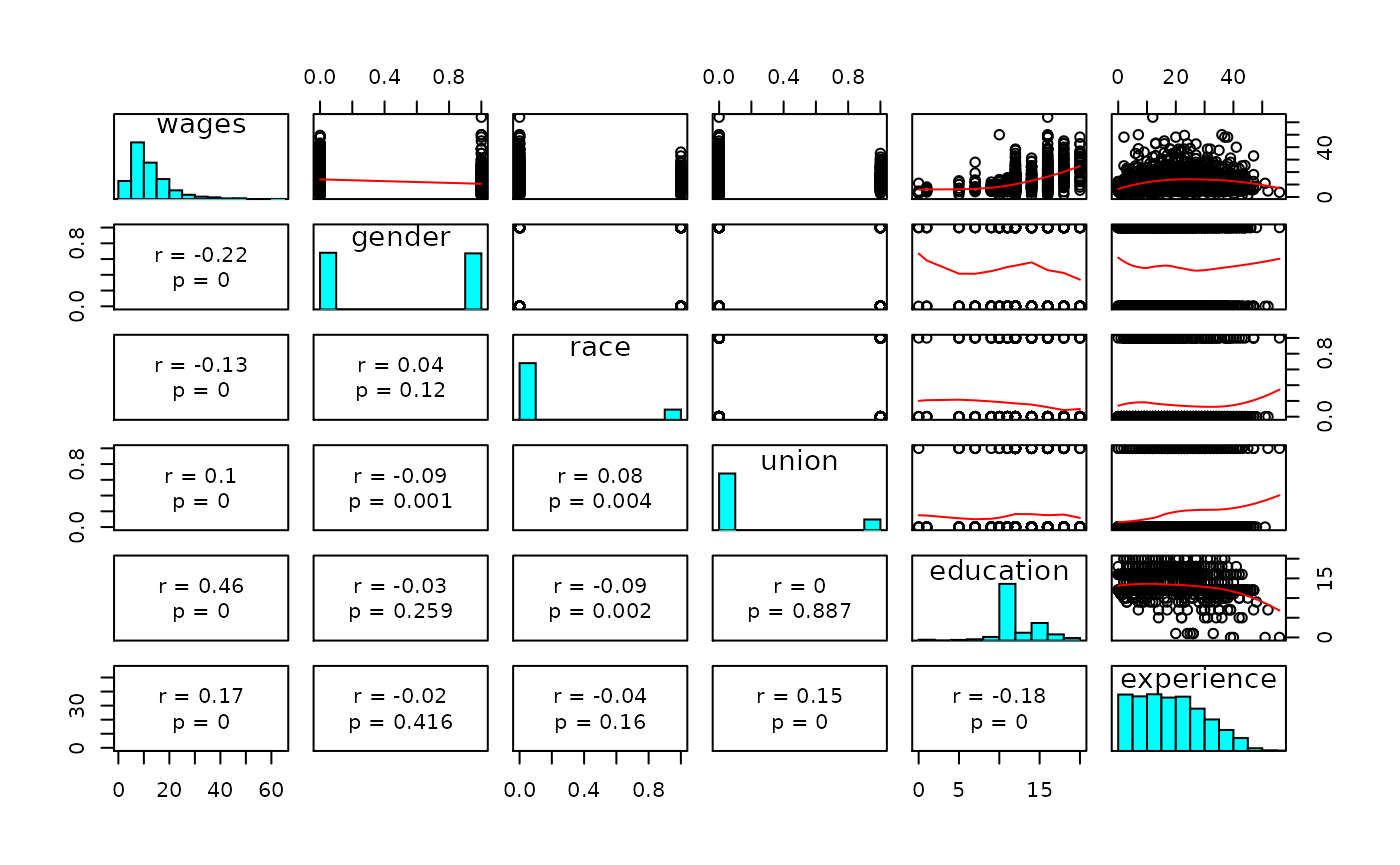
In this example, we are interested in predictors of wages. The regressor variables are gender, race, union membership, education, and work experience. The regressand variable is hourly wage in US dollars.
See jeksterslabRdatarepo::wages.matrix() for the data set used in this example.
X <- jeksterslabRdatarepo::wages.matrix[["X"]]
# age is removed
X <- X[, -ncol(X)]
y <- jeksterslabRdatarepo::wages.matrix[["y"]]
head(X)
#>      constant gender race union education experience
#> [1,]        1      1    0     0        12         20
#> [2,]        1      0    0     0         9          9
#> [3,]        1      0    0     0        16         15
#> [4,]        1      0    1     1        14         38
#> [5,]        1      1    1     0        16         19
#> [6,]        1      1    0     0        12          4
head(y)
#>      wages
#> [1,] 11.55
#> [2,]  5.00
#> [3,] 12.00
#> [4,]  7.00
#> [5,] 21.15
#> [6,]  6.92