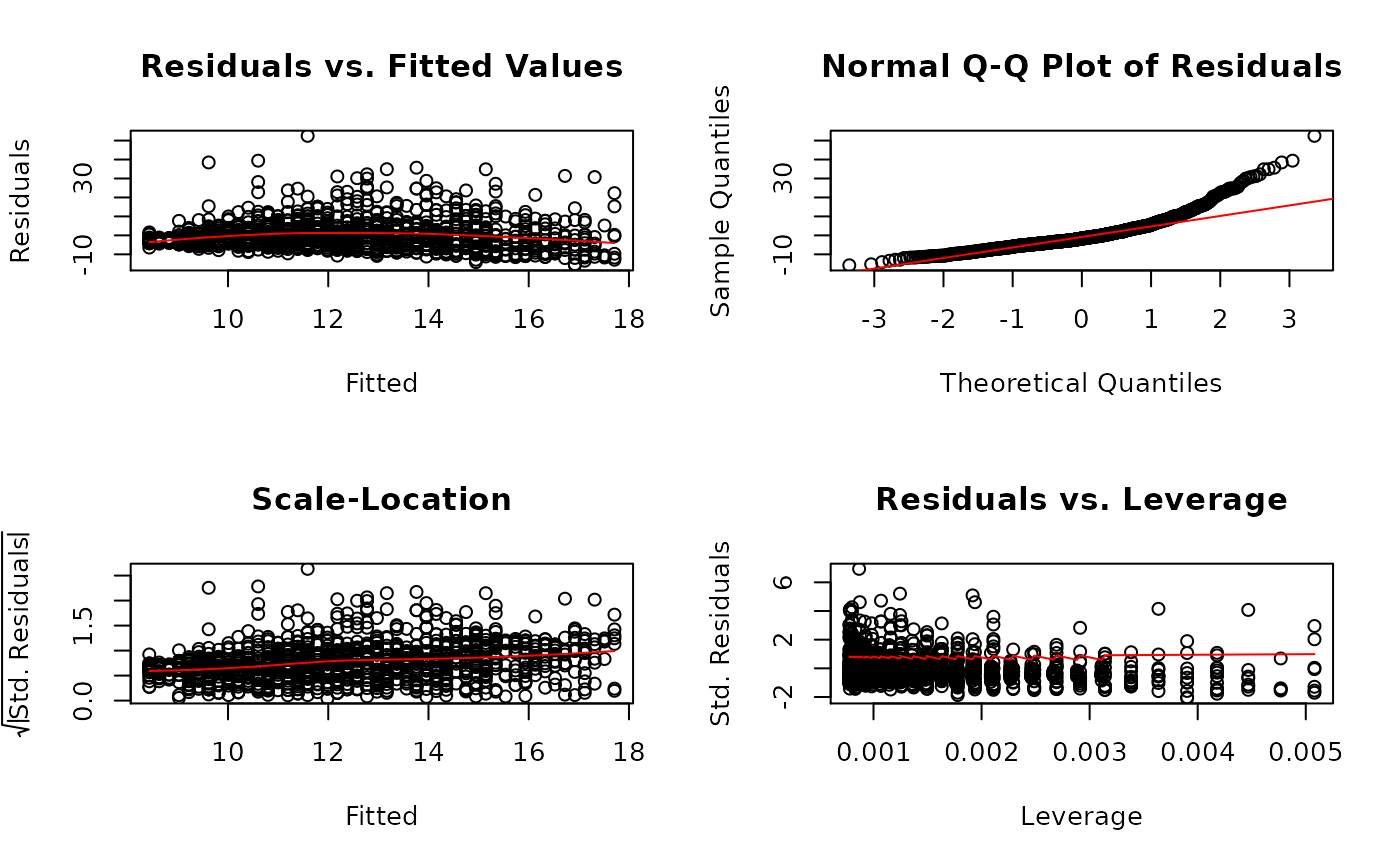
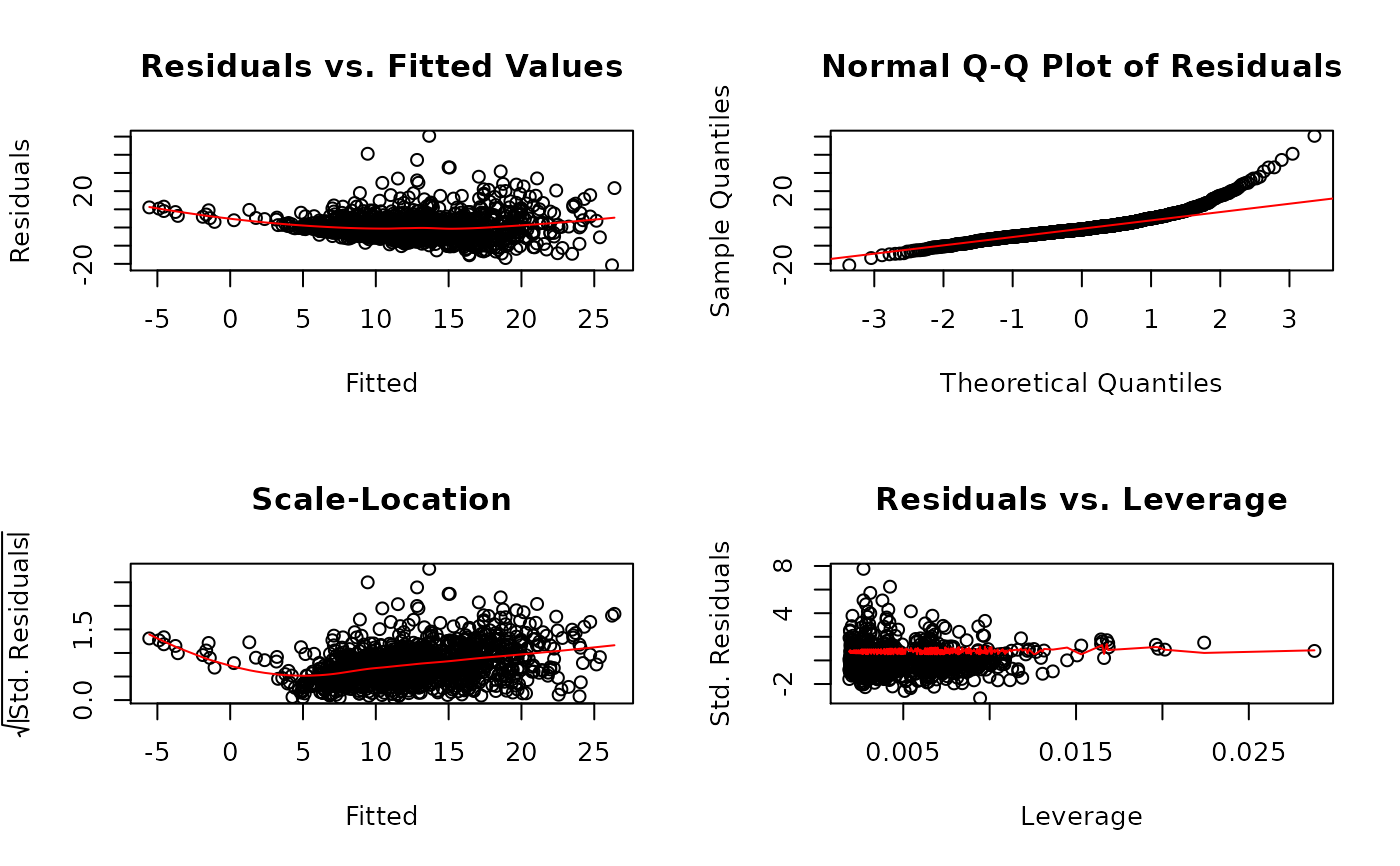
Residual Plots
residual.plot(X, y)
Arguments
| X |
|
|---|---|
| y | Numeric vector of length |
See also
Other plotting functions:
scatter.plot()
Author
Ivan Jacob Agaloos Pesigan
Examples
# Simple regression------------------------------------------------ X <- jeksterslabRdatarepo::wages.matrix[["X"]] X <- X[, c(1, ncol(X))] y <- jeksterslabRdatarepo::wages.matrix[["y"]] residual.plot(X = X, y = y)# Multiple regression---------------------------------------------- X <- jeksterslabRdatarepo::wages.matrix[["X"]] # age is removed X <- X[, -ncol(X)] residual.plot(X = X, y = y)