Parameters
n <- 50
mu <- runif(
  n = 1,
  min = 1,
  max = 2
)
sigma <- runif(
  n = 1,
  min = 1,
  max = 2
)
Variable <- c(
  "`n`",
  "`mu`",
  "`sigma`"
)
Description <- c(
  "Sample size ($n$).",
  "Population mean ($\\mu$).",
  "Population standard deviation ($\\sigma$)."
)
Value <- c(
  n,
  mu,
  sigma
)
knitr::kable(
  x = data.frame(
    Variable,
    Description,
    Value
  ),
  row.names = FALSE
)
n |
Sample size (\(n\)). |
50.000000 |
mu |
Population mean (\(\mu\)). |
1.657560 |
sigma |
Population standard deviation (\(\sigma\)). |
1.726645 |
Generate Data
x <- rnorm(
  n = n,
  mean = mu,
  sd = sigma
)
x_bar <- mean(x)
s <- sd(x)
Variable <- c(
  "`n`",
  "`x_bar`",
  "`s`"
)
Description <- c(
  "Sample size ($n$).",
  "Samnple mean ($\\bar{x}$).",
  "Sample standard deviation ($s$)."
)
Value <- c(
  n,
  x_bar,
  s
)
knitr::kable(
  x = data.frame(
    Variable,
    Description,
    Value
  ),
  row.names = FALSE
)
n |
Sample size (\(n\)). |
50.000000 |
x_bar |
Samnple mean (\(\bar{x}\)). |
1.358318 |
s |
Sample standard deviation (\(s\)). |
1.772847 |
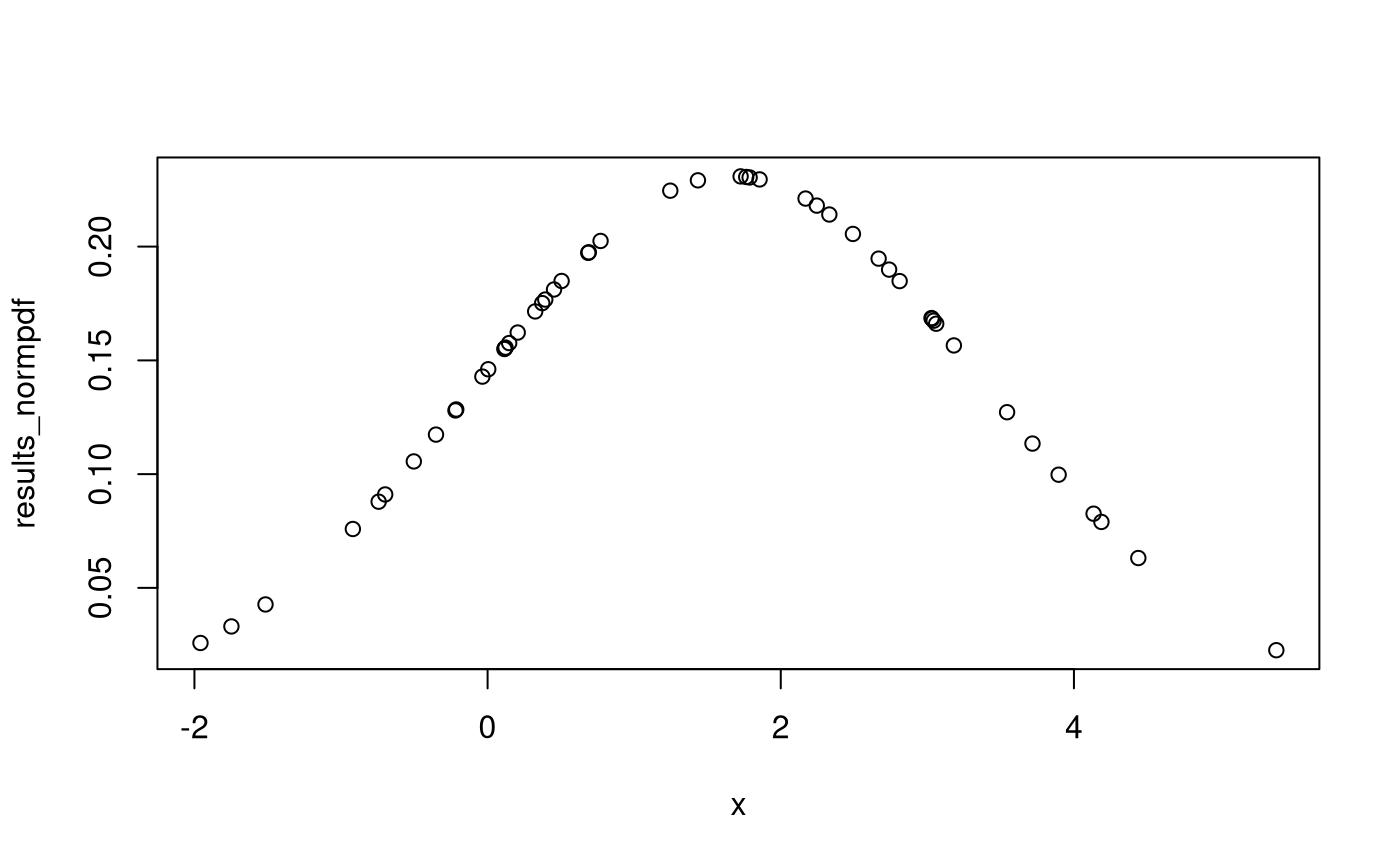
Probability Density Function
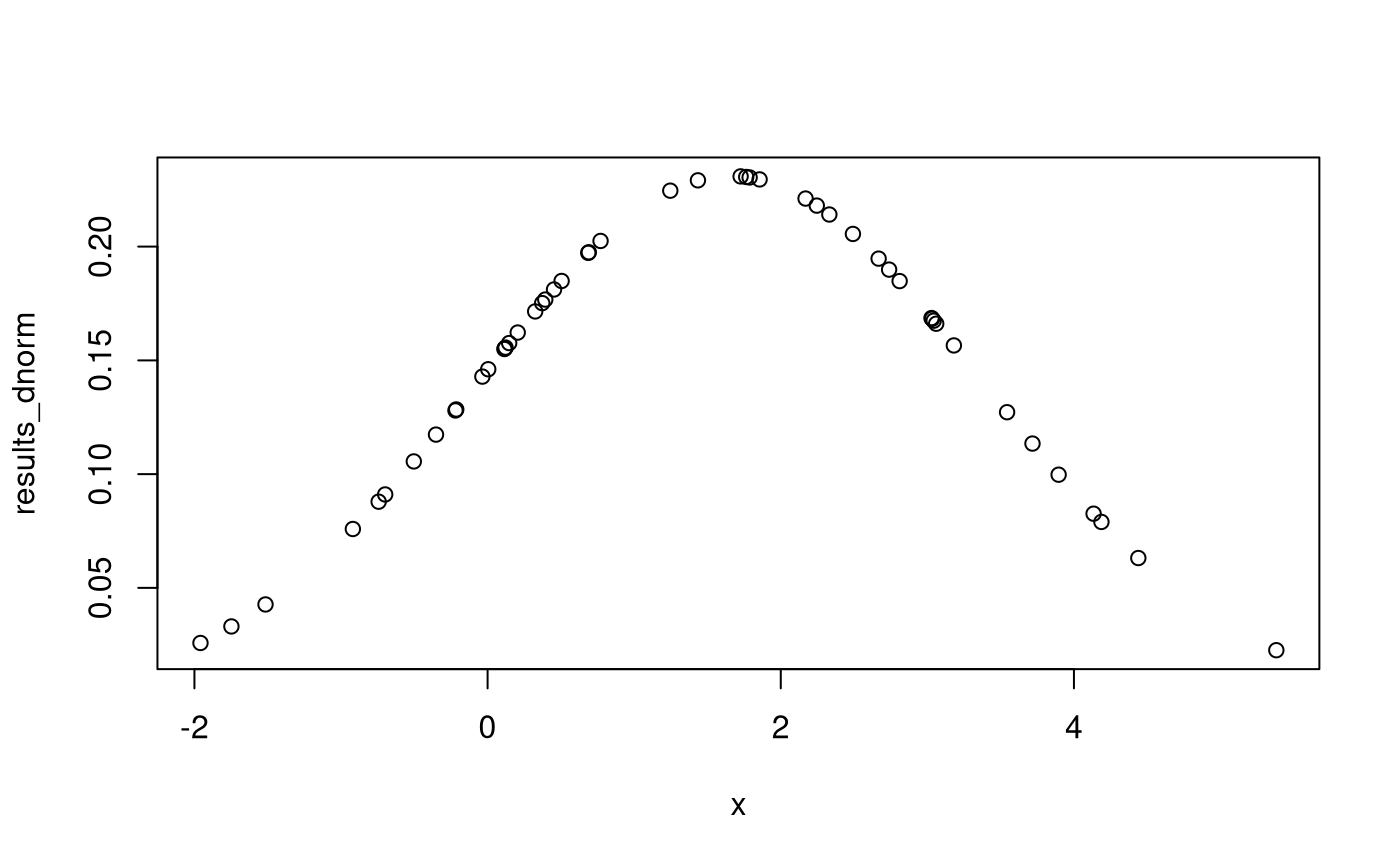
results_dnorm <- dnorm(
x = x,
mean = mu,
sd = sigma,
log = FALSE
)
results_normpdf <- normpdf(
x = x,
mu = mu,
sigma = sigma,
log = FALSE
)
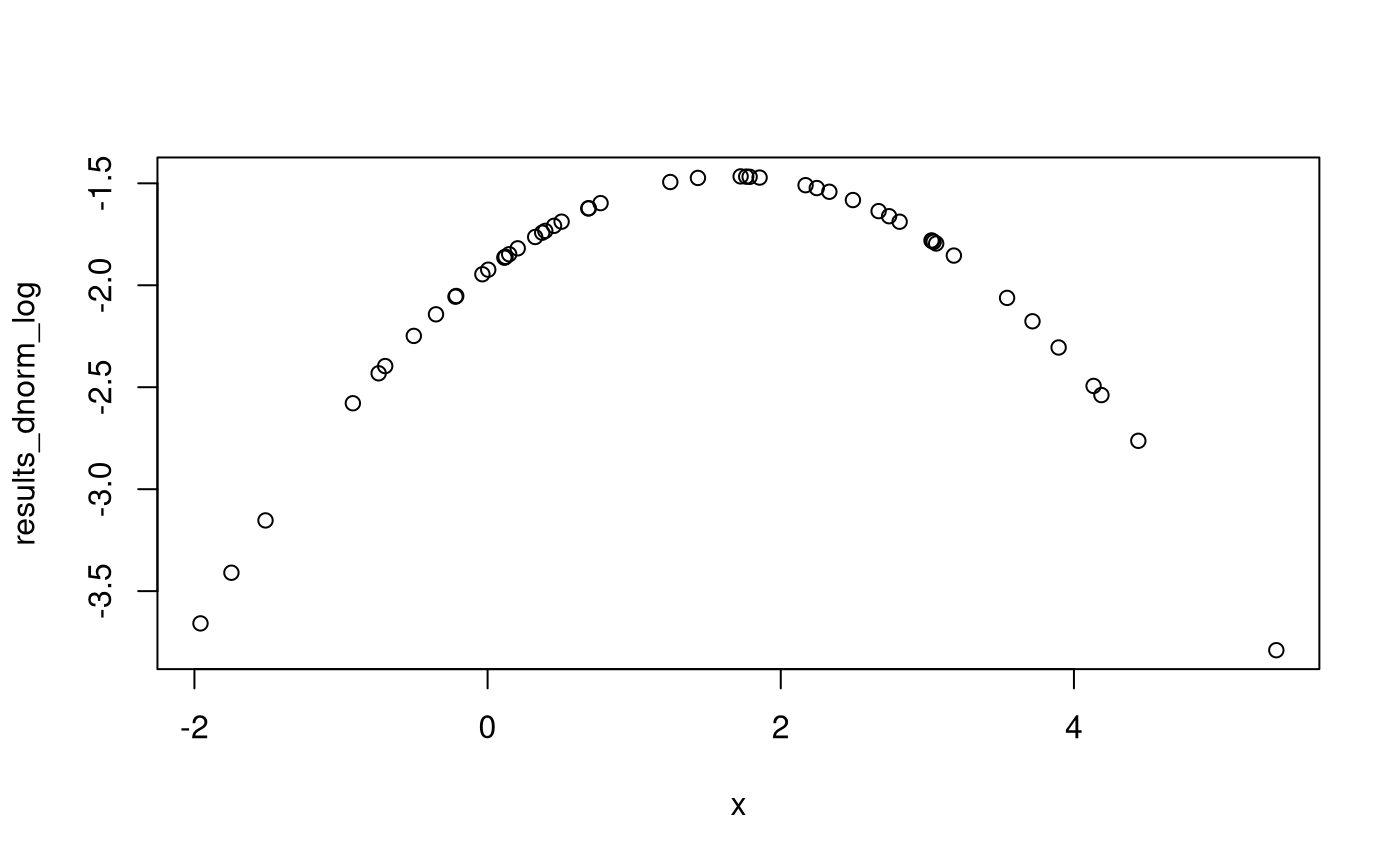
results_dnorm_log <- dnorm(
x = x,
mean = mu,
sd = sigma,
log = TRUE
)
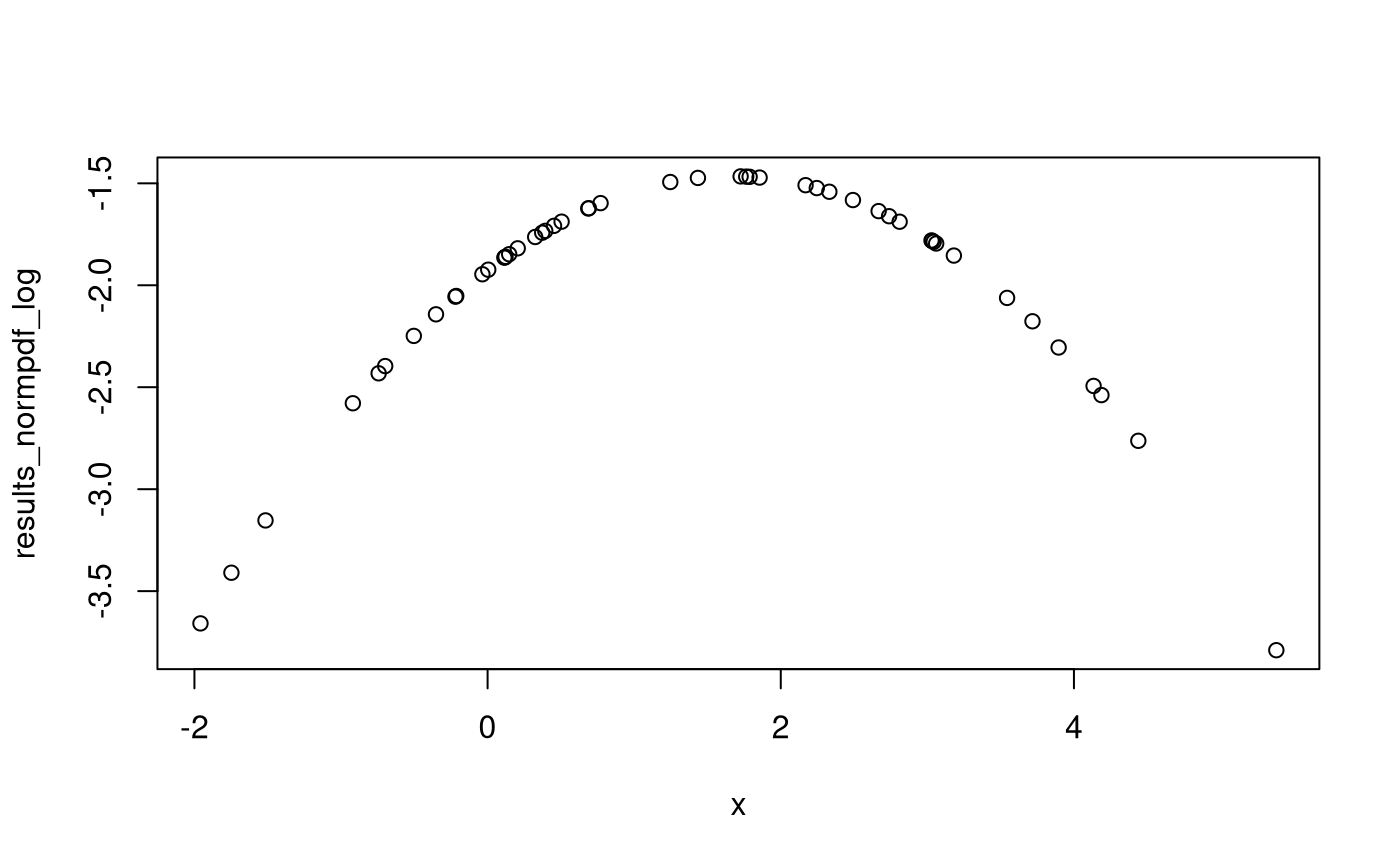
results_normpdf_log <- normpdf(
x = x,
mu = mu,
sigma = sigma,
log = TRUE
)
plot(
  x = x,
  y = results_normpdf
)
plot(
  x = x,
  y = results_dnorm
)
plot(
  x = x,
  y = results_normpdf_log
)
plot(
  x = x,
  y = results_dnorm_log
)
Summarize Results
knitr::kable(
  x = data.frame(
    x = x,
    dnorm = results_dnorm,
    normpdf = results_normpdf,
    dnorm_log = results_dnorm_log,
    normpdf_log = results_normpdf_log
  ),
  row.names = FALSE
)
| -0.9191417 |
0.0758784 |
0.0758784 |
-2.578624 |
-2.578624 |
| 3.7172006 |
0.1134296 |
0.1134296 |
-2.176573 |
-2.176573 |
| 1.7876530 |
0.2303957 |
0.2303957 |
-1.467957 |
-1.467957 |
| 0.4532147 |
0.1811598 |
0.1811598 |
-1.708376 |
-1.708376 |
| 0.1472122 |
0.1576000 |
0.1576000 |
-1.847695 |
-1.847695 |
| -0.2138225 |
0.1284189 |
0.1284189 |
-2.052458 |
-2.052458 |
| 0.3726174 |
0.1751655 |
0.1751655 |
-1.742024 |
-1.742024 |
| -0.6986924 |
0.0910595 |
0.0910595 |
-2.396243 |
-2.396243 |
| 1.7642812 |
0.2306096 |
0.2306096 |
-1.467029 |
-1.467029 |
| -0.5033766 |
0.1055813 |
0.1055813 |
-2.248274 |
-2.248274 |
| 0.0043296 |
0.1460942 |
0.1460942 |
-1.923504 |
-1.923504 |
| 0.7706340 |
0.2024936 |
0.2024936 |
-1.597047 |
-1.597047 |
| 4.1340415 |
0.0826046 |
0.0826046 |
-2.493689 |
-2.493689 |
| -0.0355401 |
0.1428615 |
0.1428615 |
-1.945880 |
-1.945880 |
| 3.1808372 |
0.1565667 |
0.1565667 |
-1.854273 |
-1.854273 |
| 3.0325584 |
0.1682678 |
0.1682678 |
-1.782198 |
-1.782198 |
| 2.6675715 |
0.1947175 |
0.1947175 |
-1.636206 |
-1.636206 |
| -1.7476934 |
0.0330457 |
0.0330457 |
-3.409864 |
-3.409864 |
| -0.2192841 |
0.1279787 |
0.1279787 |
-2.055891 |
-2.055891 |
| 0.1145370 |
0.1549849 |
0.1549849 |
-1.864427 |
-1.864427 |
| 2.7390140 |
0.1898986 |
0.1898986 |
-1.661265 |
-1.661265 |
| 3.0602823 |
0.1661086 |
0.1661086 |
-1.795114 |
-1.795114 |
| 4.1875262 |
0.0789771 |
0.0789771 |
-2.538597 |
-2.538597 |
| 4.4392023 |
0.0631151 |
0.0631151 |
-2.762795 |
-2.762795 |
| 1.8555426 |
0.2295366 |
0.2295366 |
-1.471693 |
-1.471693 |
| 0.5048483 |
0.1848954 |
0.1848954 |
-1.687965 |
-1.687965 |
| 3.0282942 |
0.1685986 |
0.1685986 |
-1.780235 |
-1.780235 |
| 0.6866873 |
0.1972659 |
0.1972659 |
-1.623203 |
-1.623203 |
| -1.5151201 |
0.0427114 |
0.0427114 |
-3.153290 |
-3.153290 |
| 0.1224199 |
0.1556169 |
0.1556169 |
-1.860358 |
-1.860358 |
| 3.5439051 |
0.1272136 |
0.1272136 |
-2.061888 |
-2.061888 |
| 0.2054902 |
0.1622300 |
0.1622300 |
-1.818740 |
-1.818740 |
| -0.3520125 |
0.1173724 |
0.1173724 |
-2.142403 |
-2.142403 |
| 2.8109510 |
0.1848468 |
0.1848468 |
-1.688228 |
-1.688228 |
| 2.4922556 |
0.2055704 |
0.2055704 |
-1.581967 |
-1.581967 |
| 0.1177275 |
0.1552408 |
0.1552408 |
-1.862778 |
-1.862778 |
| -1.9587432 |
0.0257738 |
0.0257738 |
-3.658396 |
-3.658396 |
| 0.6905769 |
0.1975154 |
0.1975154 |
-1.621939 |
-1.621939 |
| 3.8955529 |
0.0997466 |
0.0997466 |
-2.305123 |
-2.305123 |
| 0.3245913 |
0.1715106 |
0.1715106 |
-1.763110 |
-1.763110 |
| 1.2462778 |
0.2245880 |
0.2245880 |
-1.493488 |
-1.493488 |
| 1.7260982 |
0.2308686 |
0.2308686 |
-1.465907 |
-1.465907 |
| 2.3313923 |
0.2141094 |
0.2141094 |
-1.541268 |
-1.541268 |
| 3.0432495 |
0.1674370 |
0.1674370 |
-1.787148 |
-1.787148 |
| 2.2457766 |
0.2180247 |
0.2180247 |
-1.523147 |
-1.523147 |
| 1.4348746 |
0.2291370 |
0.2291370 |
-1.473435 |
-1.473435 |
| 0.3933793 |
0.1767272 |
0.1767272 |
-1.733148 |
-1.733148 |
| 2.1692434 |
0.2211246 |
0.2211246 |
-1.509029 |
-1.509029 |
| 5.3806781 |
0.0225984 |
0.0225984 |
-3.789876 |
-3.789876 |
| -0.7432199 |
0.0878814 |
0.0878814 |
-2.431767 |
-2.431767 |
Benchmarking
microbenchmark(
  dnorm = dnorm(x = x, mean = mu, sd = sigma, log = FALSE),
  normpdf = normpdf(x = x, mu = mu, sigma = sigma, log = FALSE),
  dnorm_log = dnorm(x = x, mean = mu, sd = sigma, log = TRUE),
  normpdf_log = normpdf(x = x, mu = mu, sigma = sigma, log = TRUE)
)
#> Unit: microseconds
#>         expr   min     lq    mean median     uq    max neval
#>        dnorm 1.674 1.9355 2.60573  2.197 3.1140 13.656   100
#>      normpdf 1.461 1.6505 2.40606  1.893 3.0380 13.124   100
#>    dnorm_log 1.338 1.5185 2.07308  1.737 2.7785  3.852   100
#>  normpdf_log 1.849 2.1495 2.96810  2.377 3.8700 14.221   100
testthat
test_that("normpdf log = TRUE return the same values as dnorm log = TRUE", {
  expect_equivalent(
    round(
      x = results_dnorm_log,
      digits = 2
    ),
    round(
      x = results_normpdf_log,
      digits = 2
    )
  )
})